
Dr. Martin (Marty) Zweig was the author of Winning on Wall Street, a book widely known by traders. He also produced a newsletter titled “The Zweig Forecast” for decades.
An article by Nasdaq.com accounts that, “During the 15 years that it was monitored, Zweig's stock recommendation newsletter returned an average of 15.9 percent per year, during which time it was ranked number one based on risk-adjusted returns by Hulbert Financial Digest.” Sparking further notoriety, he had a timely bearish call prior to the 1987 market crash.
Marty made market calls by developing quantitative models to determine his positioning. In the case of his bond model, intermarket inputs are combined to create a bullish or bearish outcome.
At Potomac, we routinely repurpose indicators from some of the greatest market minds in the systems development space. Even when indicators fail, there are always nuggets of wisdom that can be extracted.
Model Inputs
The Zweig bond model is an underknown timing tool that Zweig designed based on three inputs:
Dow Jones Equal Weight US Corporate Bond Index (Corporate Bonds)
Fed Funds Target Rate (Fed Funds)
Long Term Commerical Bond Yield minus Commercial Paper Yield (Yield Spread)
When buying corporate bonds, investors are displaying a willingness to take on higher credit risk relative to treasuries. The willingness to do so can be considered bullish and is thus reflected as such in Zweig’s timing model.
The rationale for the second input, interest rates, is that the appeal of short-term debt instruments, such as a money market fund, declines as the rates fall, pushing investors further out on the risk spectrum. Another byproduct is that the cost to borrow capital for corporations is lower, reducing a significant expense and increasing earning potential.
The yield spread referenced here is conceptually like the commonly followed yield curve.
In positive economic times, the yield curve upwardly slopes, with longer-duration bonds yielding more than shorter-duration. Upon inversion, longer-dated bonds no longer provide a premium in yield, indicating that investors are less optimistic about the near-term economic outlook. In this case, the yield spread shows corporate bond yields relative to 90-day commercial paper.
Translation: The system views the following events positively:
Bond prices decrease
Discount rates decrease
Long term bond yields greater than short term paper yields
These are typically signs of a strong economy: inflation is low, and money is cheap.
Model Rules
From these three intermarket inputs, Zweig created five rules. The rules can be found here:
Score +1 when Corporate Bonds rise from a low by 0.6%. Score -1 when the index declines by 0.6%.
Score +1 when Corporate Bonds rise from a low by 1.8%. Score a -1 when the index declines by 1.8%.
Score +1 when Corporate Bonds cross above their 50-day moving average by 1%. Score -1 when the index crosses below its 50-day MA by 1%.
Score +1 when the Fed Funds Target Rate drops by at least ½ point. Score a -1 when it rises by at least ½ point.
Score +1 when the yield spread crosses above 0.6. Score a -1 when the spread falls below -0.2. Score it 0 for a neutral score between -0.2 and 0.6.
After going through each rule, the scores are tallied, and a composite is formed. If the total is +1 or higher, Zweig recommends risk-on. If the total is -1 or lower, a defensive posture is recommended.
Where are we today?
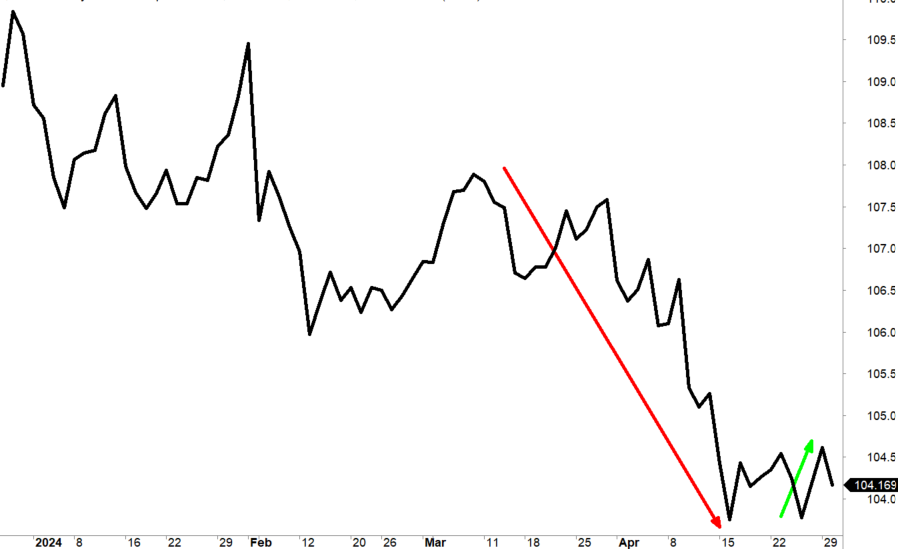
The green arrow in the chart below reflects rule one, a corporate bond rise of 0.80%. Score +1.
The red arrow is the last decline greater than 1.8% as outlined in rule 2. Score -1.
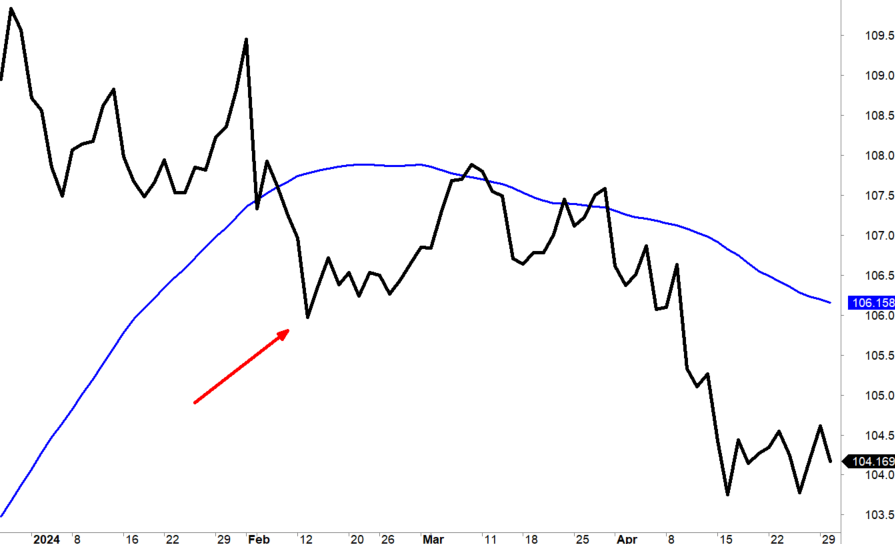
Rule three states that Corporate Bonds are to be above or below the 50-day moving average by 1%. The chart below shows the signal was on 2/13/2024 when the index went 1.67% below the 50-day, as represented by the blue line. There has been no signal in the opposite direction since. Score -1.
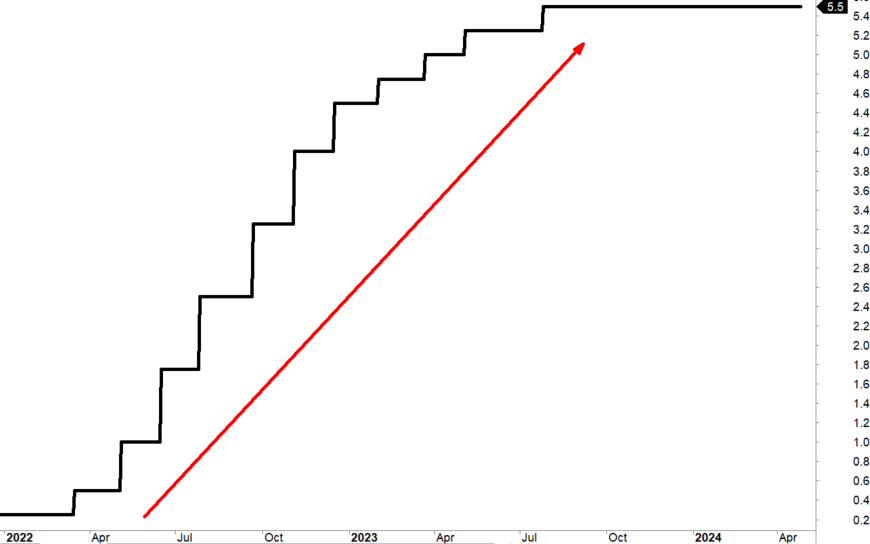
Rule four looks at the last ½ point or greater move in the Fed Funds Rate. The rate hikes that began in early 2022 have not reversed. Score -1.
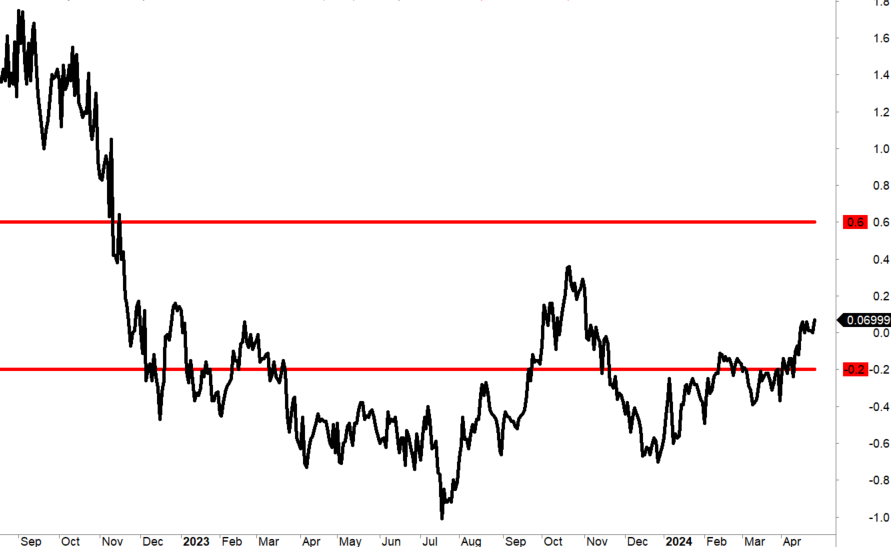
The final rule examines the yield spread. If between 0.60% and –0.20%, as shown by the red lines below, the score is 0.
Tallying the Scores
Rule 1: +1
Rule 2: -1
Rule 3: -1
Rule 4: -1
Rule 5: 0
Total: -2
Result: Cash
Potomac Use Case
Over the years, we made some critical improvements to the original system.
To better capture high and low pivot points, we replaced the vague “recent high and recent low” descriptions with a traditional Zig Zag indicator.
We added a one-week delay because getting accurate and timely data from the government (FRED) is impossible.
We added a Yield Return ratio that captures the difference between Long-Term Commerical Bond Yield and Inflation (CPI).
We used the Prime Rate as an additional data point for years, but over time, it proved to add very little value and was abandoned.
At Potomac, we NEVER use just one indicator; rather, we manage money using a composite-based system, a collection of various stock market indicators. We use a modified version of the Zweig Bond Model as an inflation and interest rate-based intermarket indicator.
*Charts and data are as of 4/30/2024. Past performance is not a guarantee of future results.
Disclosure: Past performance does not guarantee future results. There is no guarantee that any investment strategy or account will be profitable or will avoid loss. Individual investors’ objectives, financial situations, their specific instructions, or restrictions on investments, or the time at which an account is opened, or additions are made may result in different trades and returns. Performance for the strategy presented may differ materially (more or less) from the performance of the comparable benchmark and other Potomac investment strategies. Market and economic conditions could change in the future producing materially different returns. You cannot invest directly in an index. This presentation is supplemental to the composite report. This information is prepared for general information only and should not be considered as individual investment advice nor as a solicitation to buy or offer to sell any securities. This material does not constitute any representation as to the suitability or appropriateness of any investment advisory program or security. Please visit our FULL DISCLOSURE page.
PFM-323-20240502