

If you look at the equity market in the United States, it appears that there is no reason for fear. The S&P 500 closed at a record level, completing its fifth consecutive weekly advance. The popular narrative is that inflation has been beaten, with the Consumer Price Index steadily moving toward that magic 2% number. (Side note: I spent $45 on three deli sandwiches on Saturday—make of that what you will regarding “inflation has been beaten.”)
It seems the consensus among investors is that all is well. However, we wanted to dig a bit deeper this week to provide a more balanced perspective. It seems the fixed income and volatility markets have a slightly different view of the world than the equity markets.
So, who do you believe?
S&P 500
If the S&P 500 was your only gauge of “the market,” the bullish take would seem to be correct. Another new high, five positive weeks in a row, and trading above a steadily rising 60-week moving average. What’s not to like?
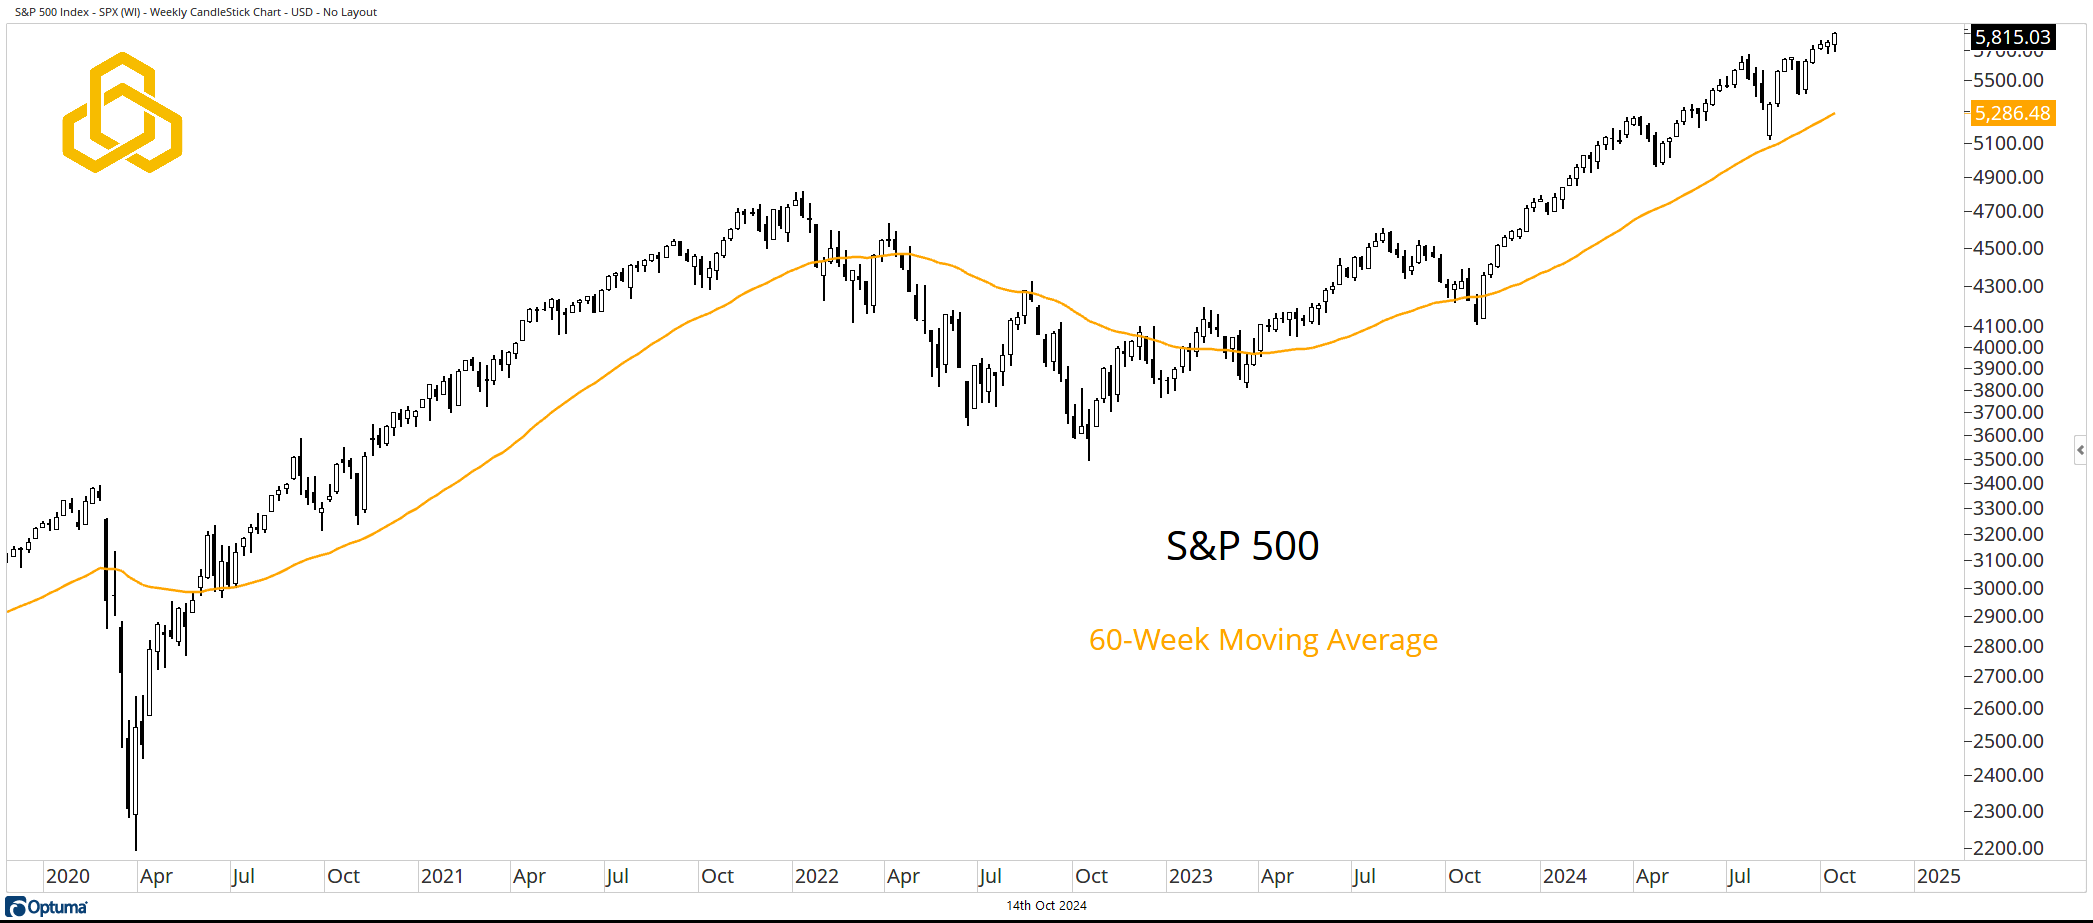
Source: Optuma
The 10-Year Treasury Note
The 10-Year Yield closed higher for the third time in four weeks and has regained the 10-week moving average. Needless to say, bond prices have been moving lower over this time frame, inverse to the direction of stock prices.
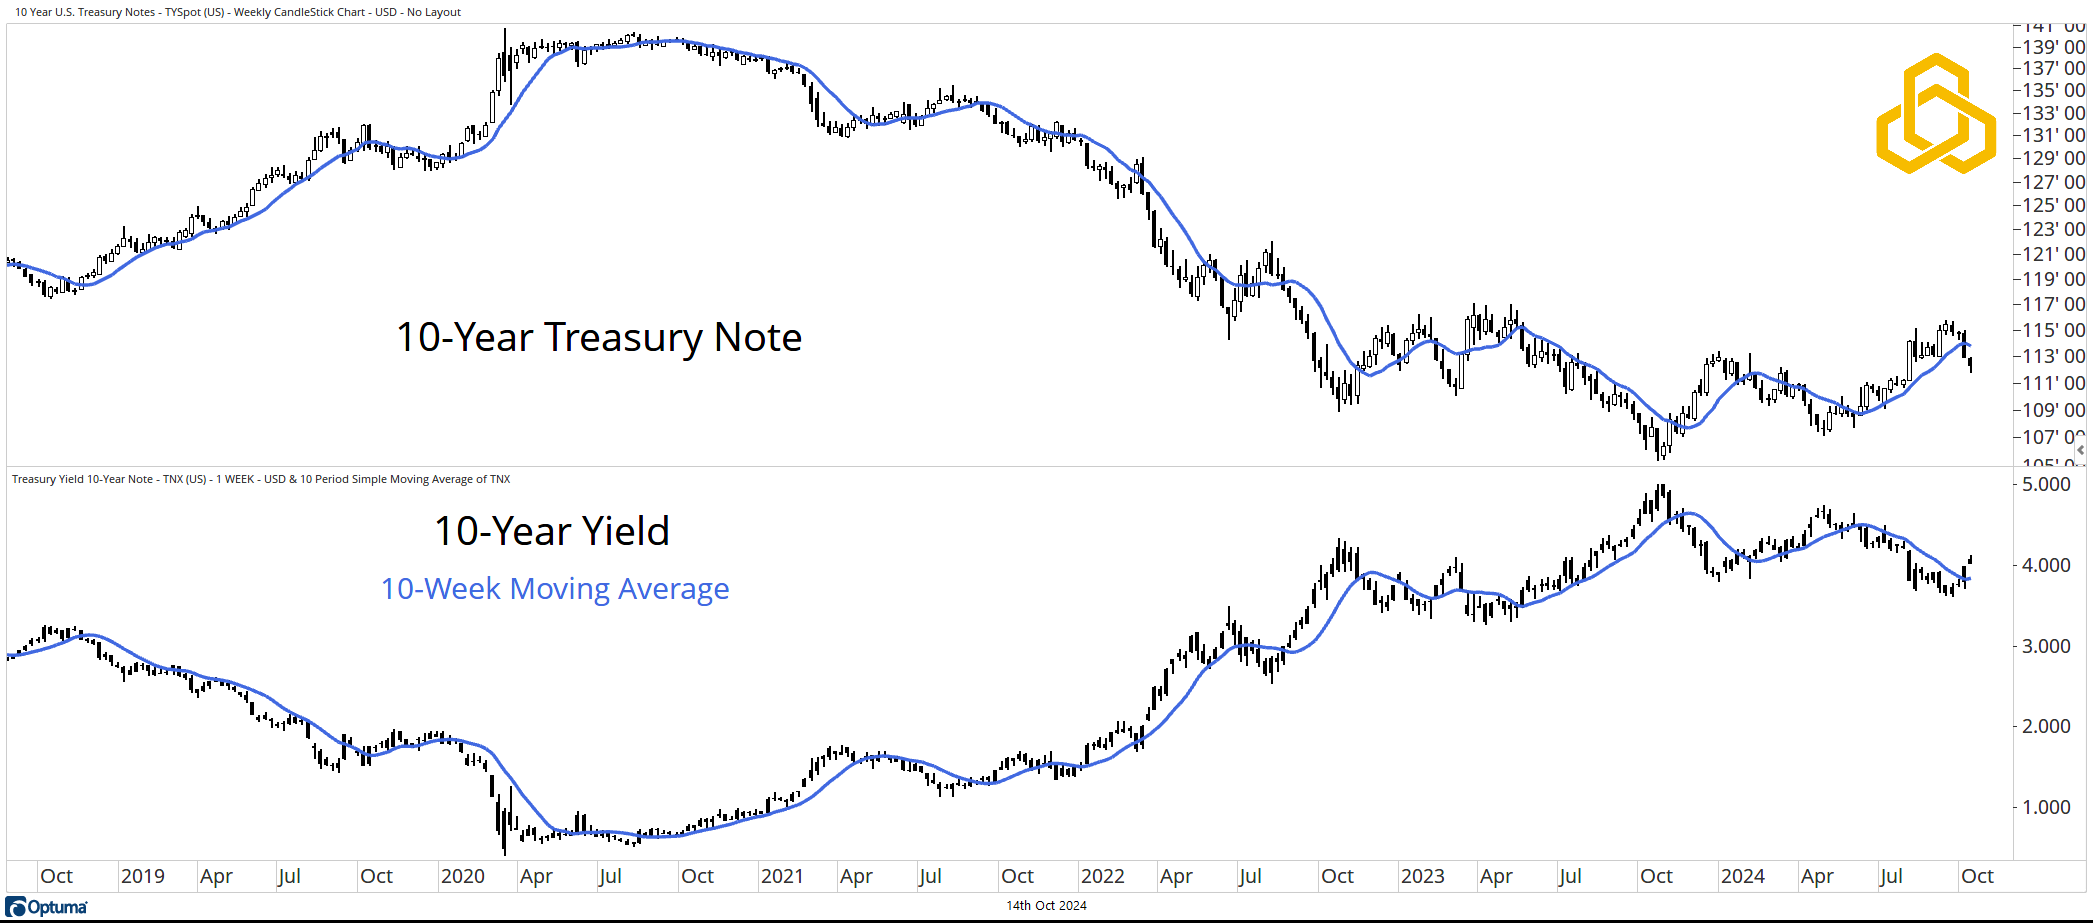
Source: Optuma
Inflation Composite
Our Inflation Composite aims to dive deeper than the Consumer Price Index by incorporating both five- and ten-year market expectations for inflation. Our composite has started to move higher and remains well above the linear regression taken from the Global Financial Crisis through the COVID-era stimulus.
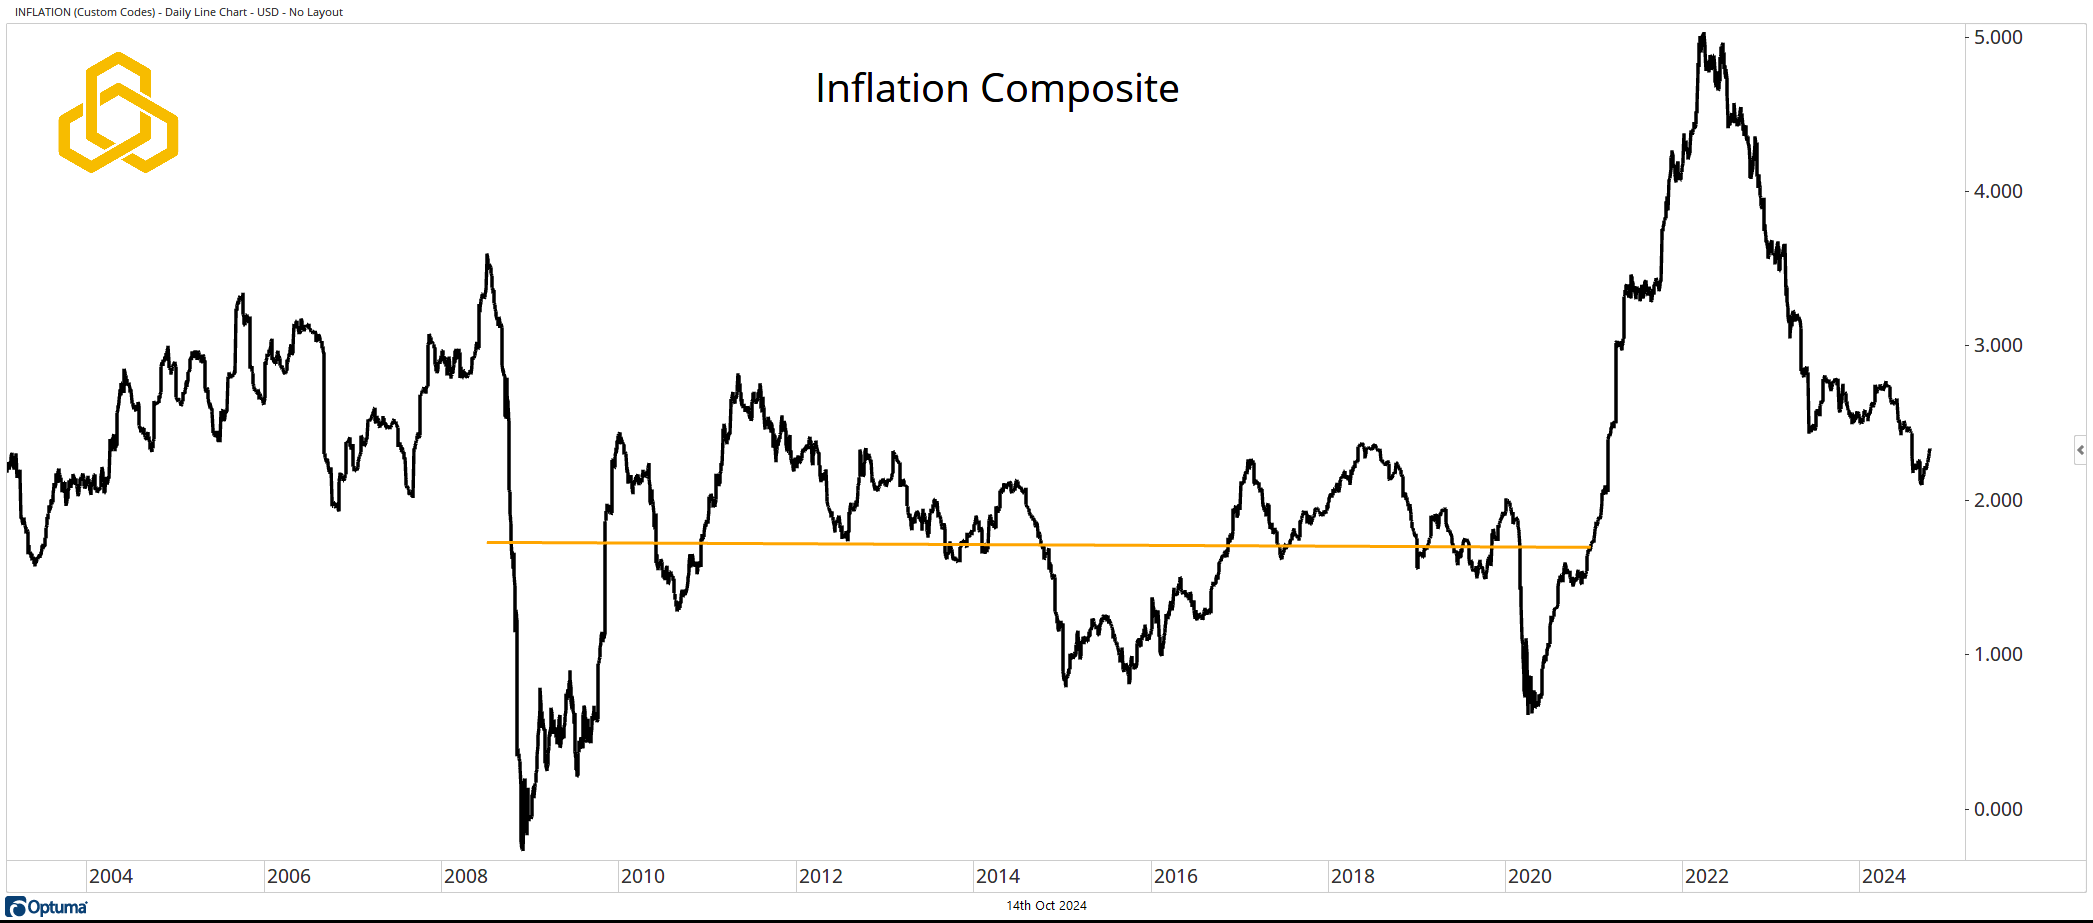
Source: Optuma
Short-Term TIPS vs. Aggregate Bonds
Despite the downward trend in Consumer Price Index (CPI) that the media likes to highlight, short-term Treasury Inflation-Protected Securities (TIPS) are still being bid up relative to the broader bond market. The ratio is holding in a consolidation near five-year highs, above the 50-day moving average.
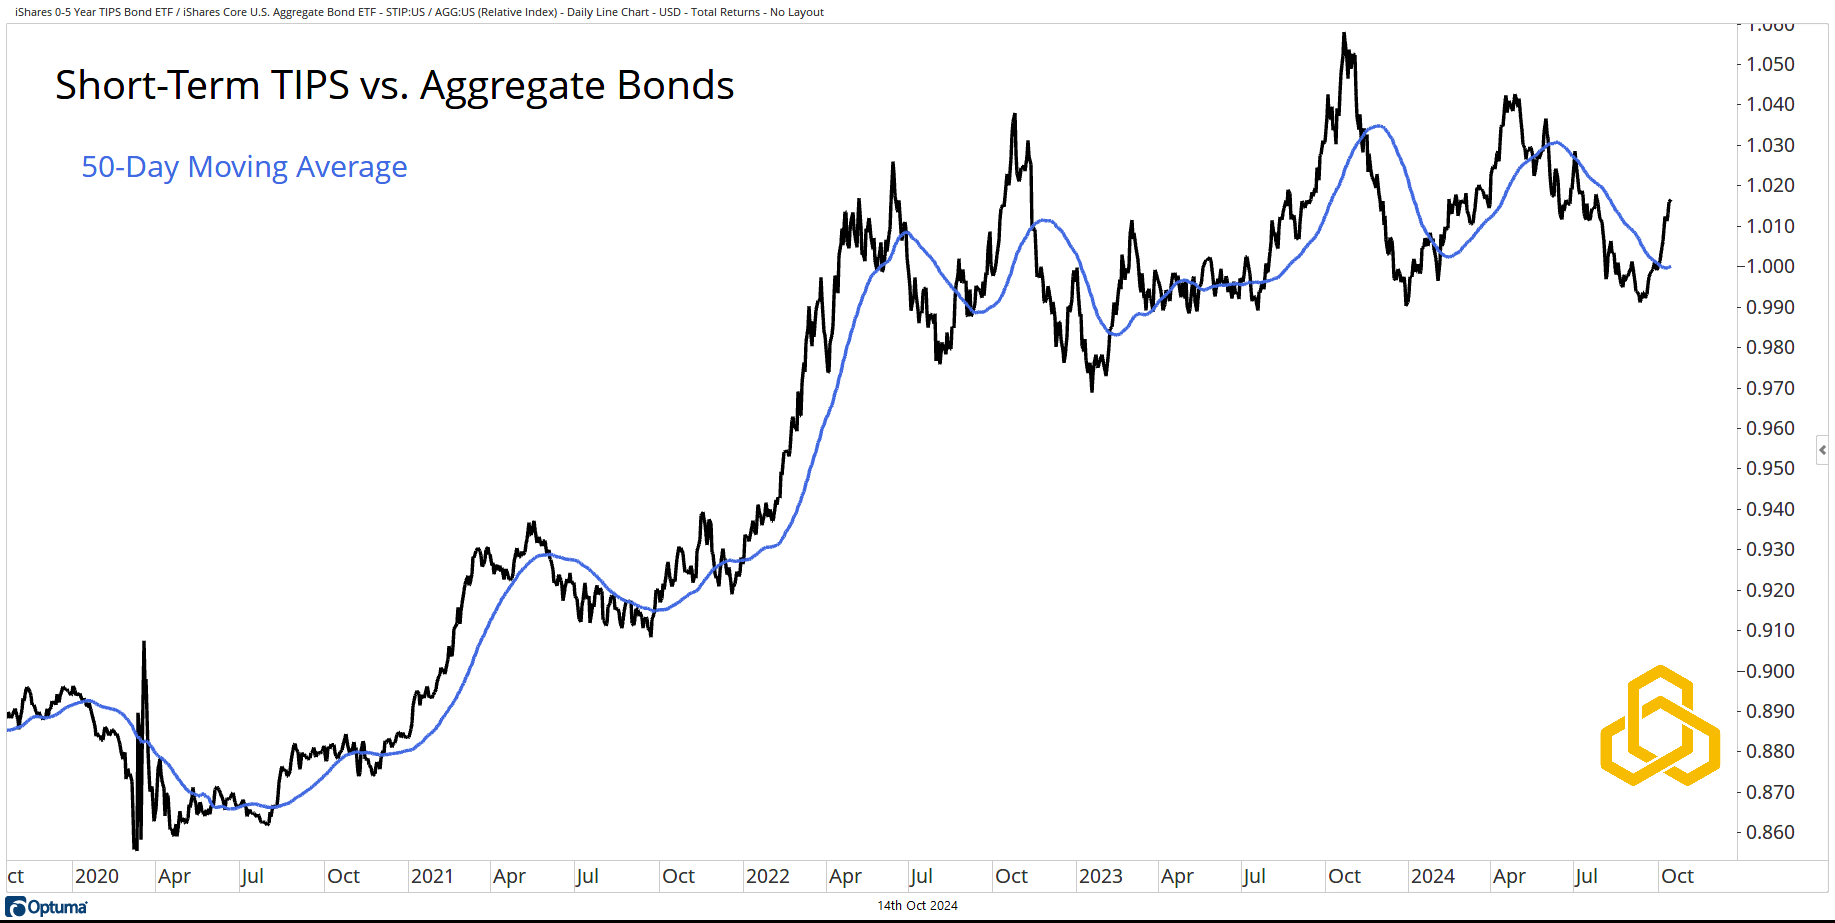
Source: Optuma
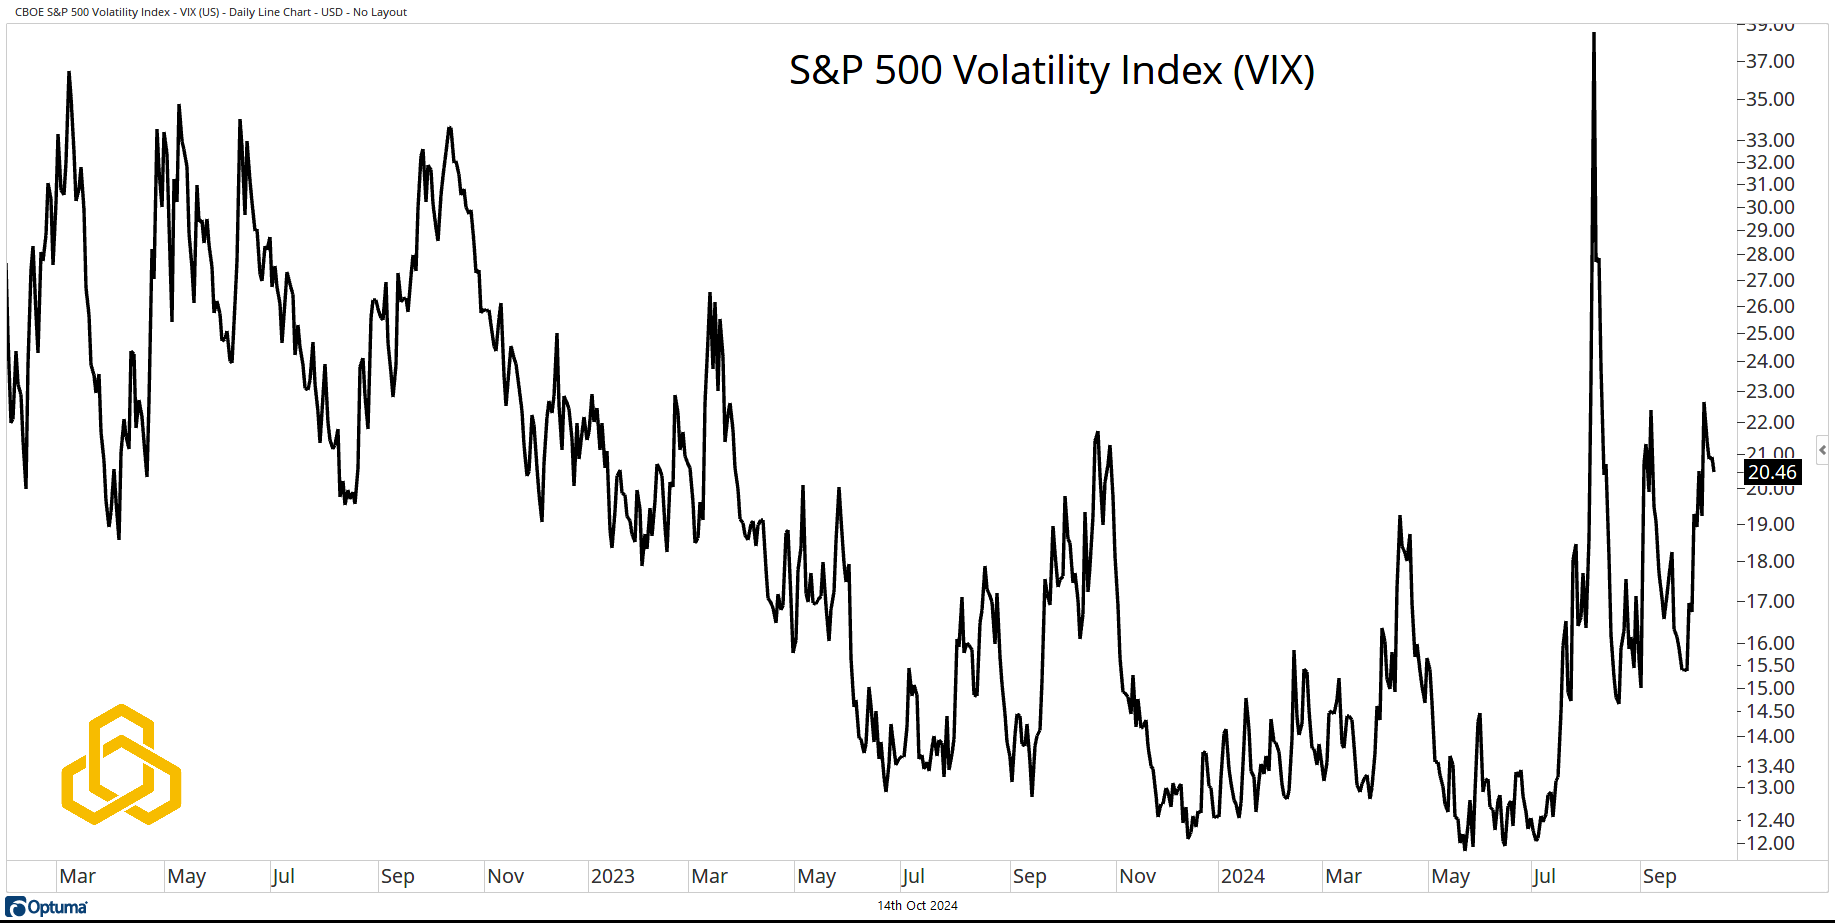
The VIX
Finally, after the massive volatility spike in early August, the S&P 500 Volatility Index (VIX) remains somewhat elevated. The current reading of 20.46 implies 1.28% daily moves for the S&P 500 over the next month.
Perhaps this is nothing more than the market pricing in the uncertainty of the upcoming presidential election. If that is the case, bulls will want to see a lower VIX after Election Day.
Source: Optuma
Disclosure: This information is prepared for general information only and should not be considered as individual investment advice nor as a solicitation to buy or offer to sell any securities. This material does not constitute any representation as to the suitability or appropriateness of any investment advisory program or security. Please visit our FULL DISCLOSURE page.
PFM-362-20241014