
The concept of volume thrusts is as old as technical analysis itself. The logic is straightforward: When there is a sudden inflow of buyers entering the market, the odds of above average short term future gains increase.
At its core, this is basic supply and demand.
The sudden inflow of buyers will be reflected in volume and breadth numbers. Trends are formed when buying pressure exceeds selling pressure, and a surge in buyers can signal the start of a new trend or the continuation of an existing one.
Volume Thrust Example
Paul Desmond, a pioneer in technical research and founder of Lowry’s Investment Research, won the Charles H. Dow Award in May 2002 for his paper, “Identifying Bear Market Bottom and New Bull Markets”.
In his research, Desmond observed that bull markets often begin or continue when demand surges. He measured this demand using the volume of advancing stocks relative to total market volume, calculated as:
Volume for Advancing stocks / ( Volume for advancing stocks + Volume for Declining Stocks)
According to his findings, a bullish signal can occur in two ways:
1. Two consecutive days with a ratio above 80%.
2. A single day with a ratio exceeding 90%.
Results
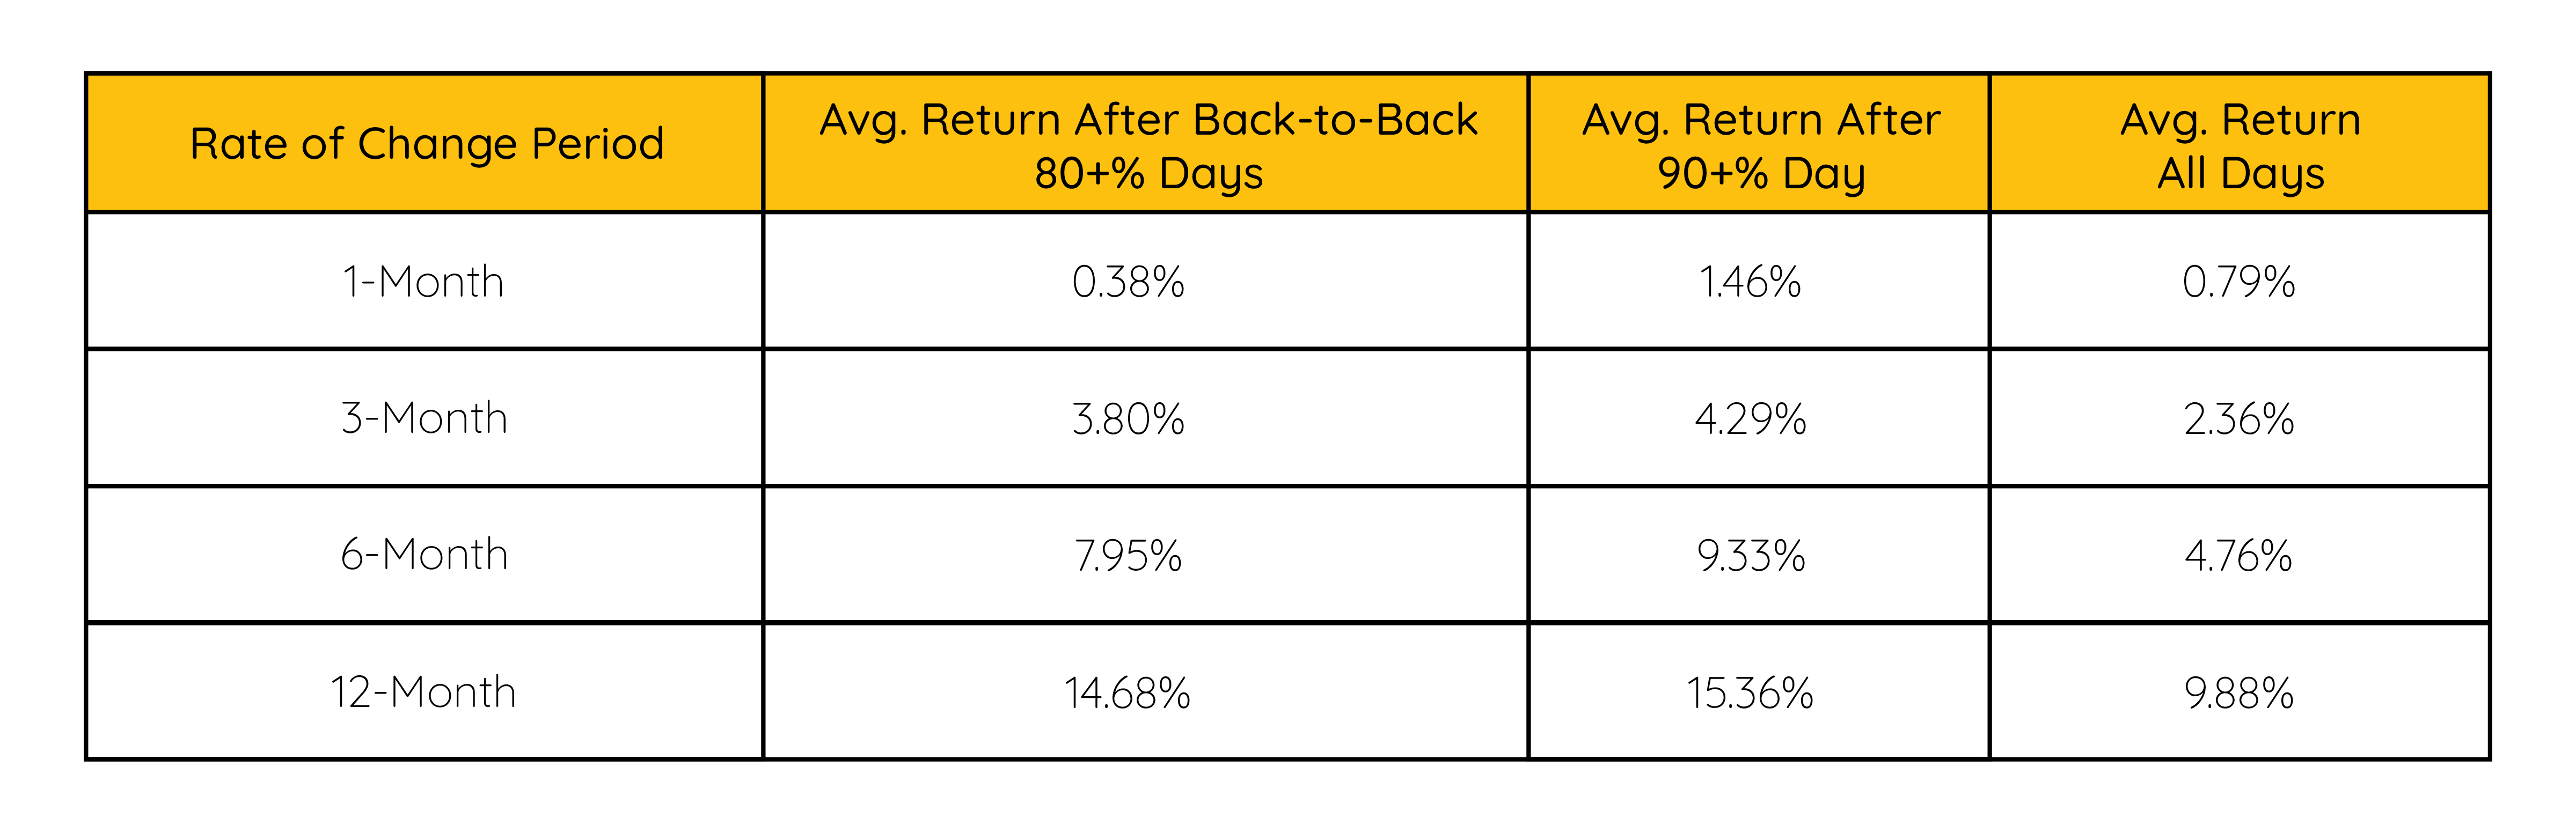
The table below uses S&P 500 Index data from 1990 through January 2025 to analyze average performance over varying time intervals following each signal.
Source: Norgate
The data supports Desmond’s thesis: strong volume thrusts tend to precede favorable market periods.
All timeframes, except for the one-month period following back-to-back 80% days, showed significant outperformance relative to all periods.
This simple example illustrates the potential impact of a strong volume thrust on market trends.
Example Signals
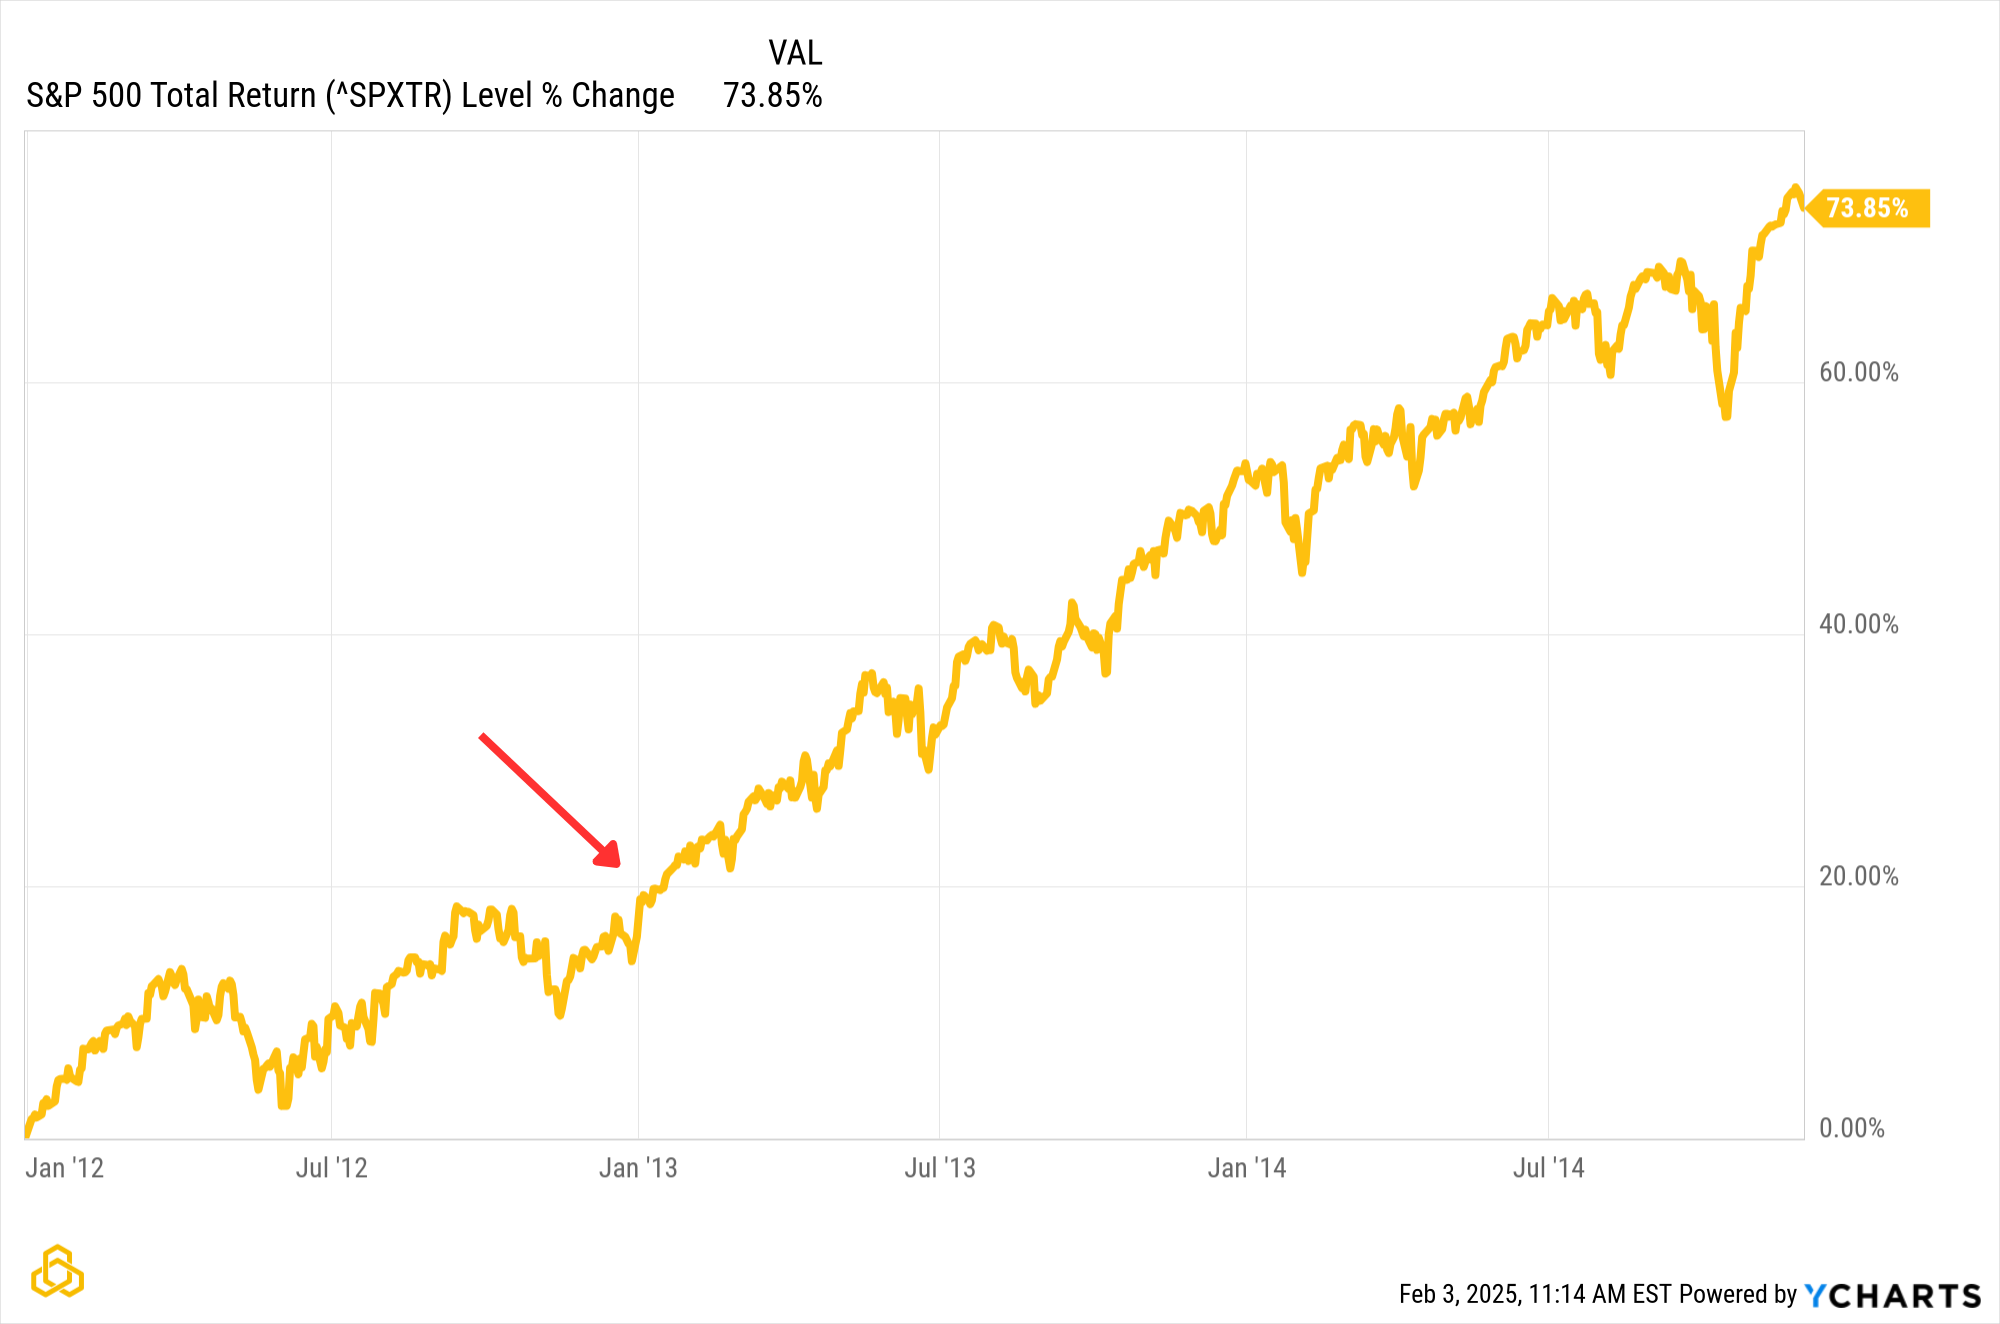
For a visual on how thrusts can potentially signal future gains, see the chart below of the S&P 500 Total Return Index.
12/31/2012 and 1/2/2013 marked two consecutive days where the ratio of volume of advancing stocks relative to all stocks was greater than 80%.
As a result, 1/3/2013 marked a bullish signal, confirming the uptrend that had started earlier.
Source: Ycharts
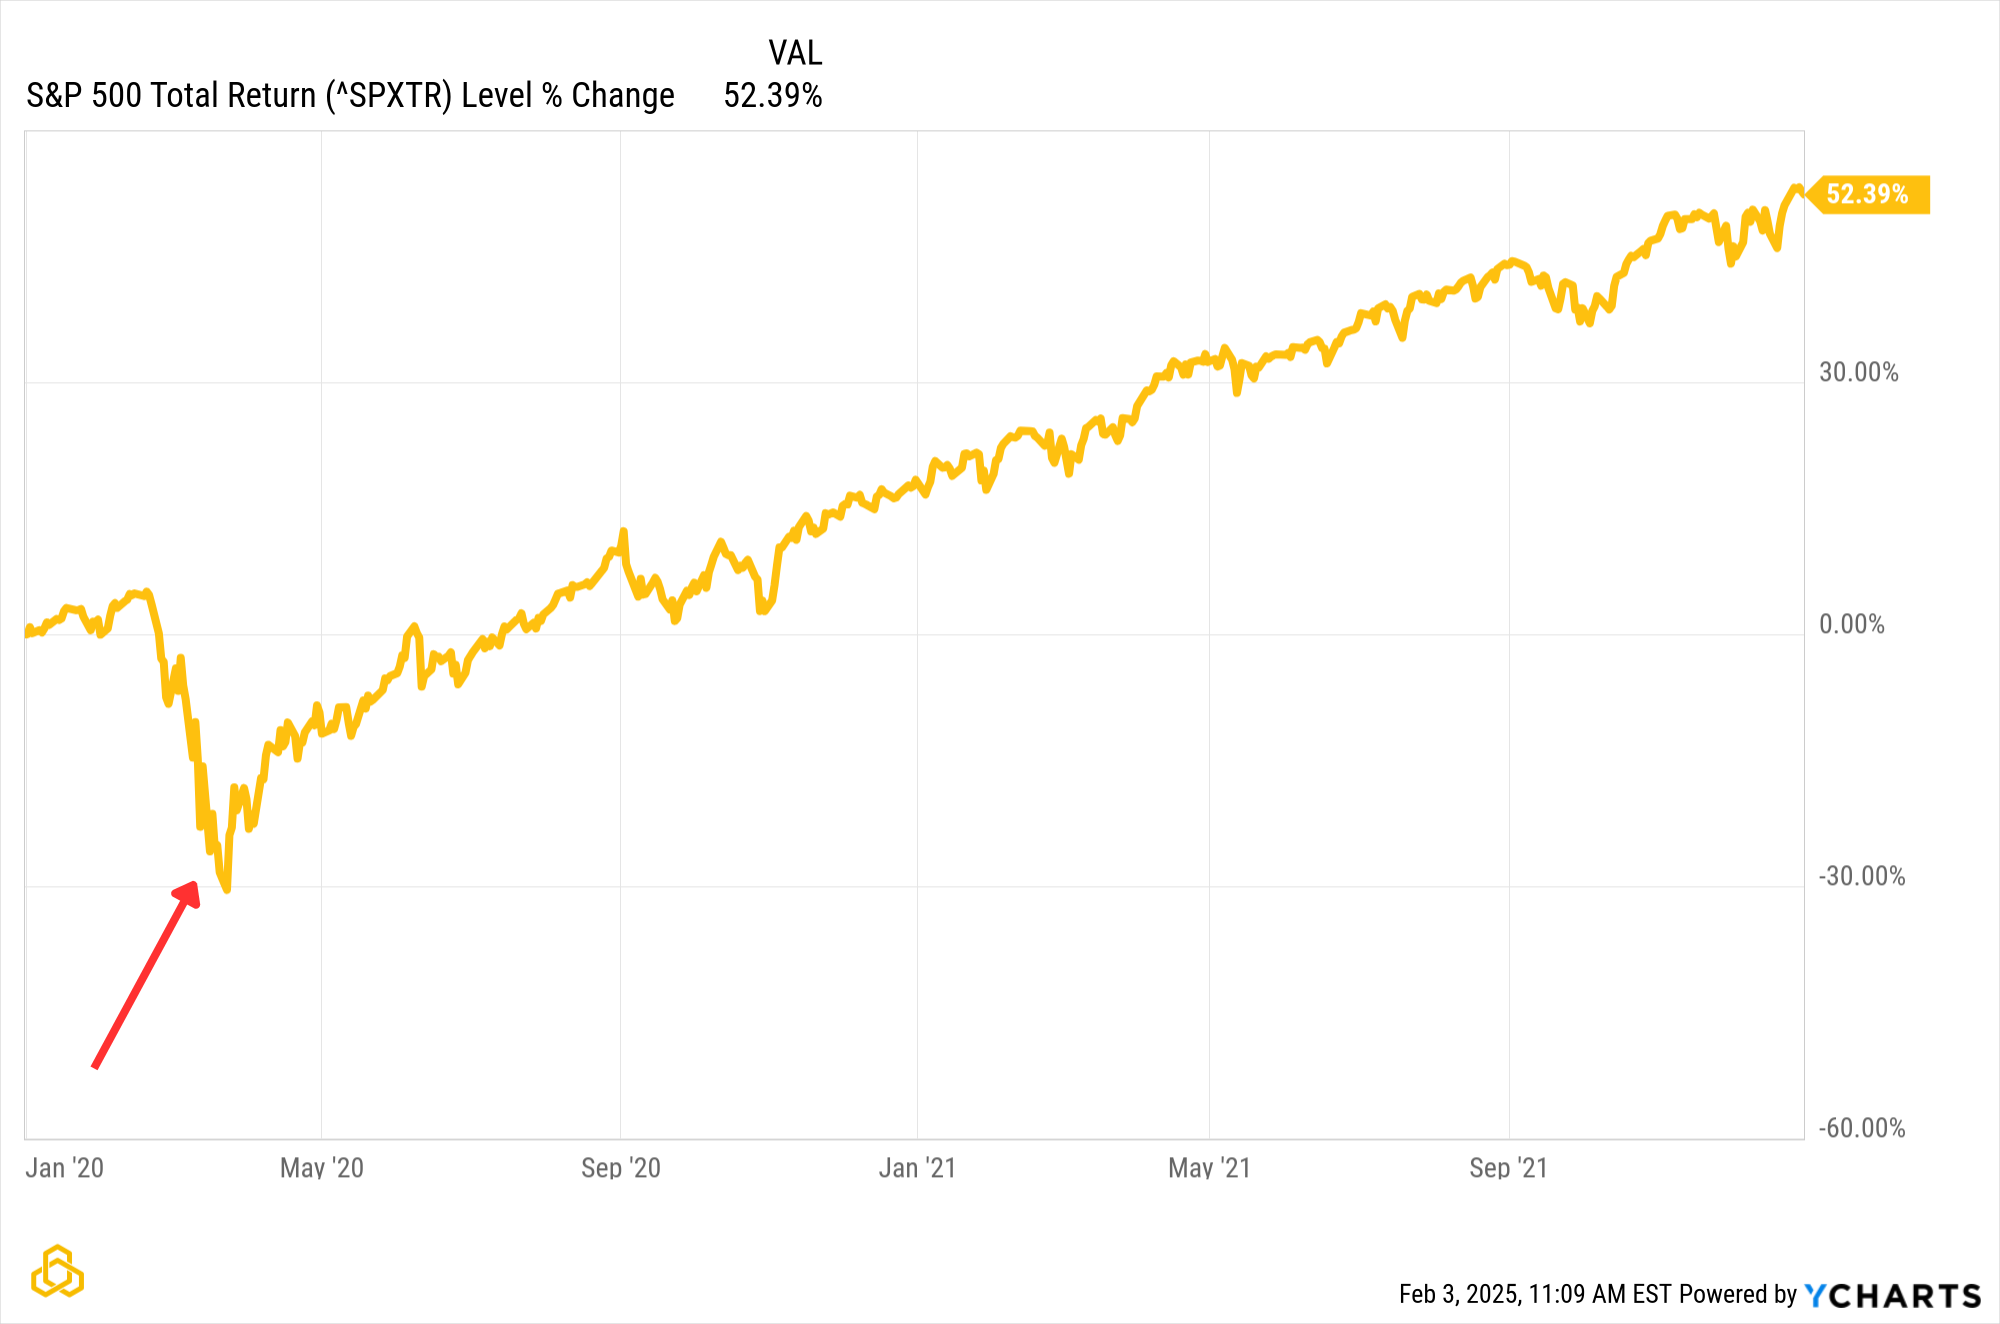
The second example came toward the end of the sharp decline that was the 2020 bear market, where on 3/13/2020 a 90% up day occurred.
/Source: Ycharts
The two examples shown were clearly great entries, but they were picked with that in mind to illustrate what the winning signals could look like. It is important to note that not all signals using Desmond’s method yield these results.
All tactical indicators have losing trades. The goal isn’t to be right on every trade, it is to increase the odds of success over time. As the data along with these two examples show, volume thrusts have the potential to do that.
Potomac Use Case
For any indicator to be useful, it must be formed in a way that can be practically used in an overall trading strategy.
Discretionary traders may interpret a volume thrust as confirmation to increase exposure. Quantitative traders, however, face a challenge since these signals are infrequent, requiring integration into a more complete model.
At Potomac, our composite model accounts for volume thrusts like the one outlined here. Desmond’s original work suggests that a signal can happen with just one day of movement, or two of a lesser degree. Our research indicates that averaging thrust levels over time can further improve the odds of outperformance.
When this happens, we want the likelihood that our composite model is invested to increase. The data shown in this note supports this, as does the theory of supply and demand.
Disclosure:
Potomac Fund Management ("Potomac") is an SEC-registered investment adviser. This information is prepared for general information only and should not be considered as individual investment advice nor as a solicitation to buy or offer to sell any securities. This material does not constitute any representation as to the suitability or appropriateness of any investment advisory program or security. Please visit our disclosure page for more information. Potomac does not make any representations or warranties as to the accuracy, timeliness, suitability, completeness, or relevance of any information prepared by any unaffiliated third party, whether linked to the Potomac website or incorporated herein, and takes no responsibility for any of this information. The views of Potomac are subject to change and Potomac is under no obligation to notify you of any changes. Different types of investments involve varying degrees of risk, and there can be no assurance that the future performance of any specific investment or investment strategy will be profitable or equal to any historical performance level.
PFM-390-20250210