
Correlation is often a misunderstood descriptive statistic in markets.
A common mistake is accepting the average correlation without considering the variation around it. The second mistake is assuming the average correlation will remain static.
As will be shown, in times of crisis, most assets have declined together, and the prior correlations of those assets didn’t help diversify traditional portfolios.
Tactical strategies attempt to reduce the reliance on historical correlation by accepting that correlations change and being willing to adapt to them rather than blindly accept them.
Correlation Simplified
The Oxford Dictionary defines correlation as “a mutual relationship or connection between two or more things.”
More specifically, it measures the degree of co-movement between variables using a bounded indicator that falls between +1 and -1. In the extremes, the correlation is either +1 or –1, where the variables move perfectly in unison or exactly inversely to each other.
To illustrate, imagine two vehicles traveling on a highway. They can travel in the same direction, in opposite directions, or without relativity at all.
Correlation operates in this way. It does not account for the speed of the cars, only direction.
There are three possible states: positive, negative, and zero.
On the contrary, positive correlation refers to both cars in their respective lanes, always traveling in the same direction. In this case, the correlation is +1. Or, in math terms, perfect correlation.
Negative correlation is one car going due North while the other is going south. The exact opposite direction, regardless of varying speeds. That is perfect negative correlation reflected as the number -1.
Zero correlation is when the direction of the two vehicles has no relationship to each other.
Correlation Is Not Static
The previously discussed example represents correlation in the extremes when they are perfectly positive, negative, or zero. As we know, the real world does not operate in this capacity. Correlations are ever-changing in financial markets and are rarely perfect.
The correlation between any two securities will be dynamic. Swings around an average are to be expected.
For example, view the chart below of the rolling 12-month correlation between stocks and bonds represented by the SPDR S&P 500 ETF Trust (SPY) and the iShares 20+ Year Treasury Bond ETF (TLT).
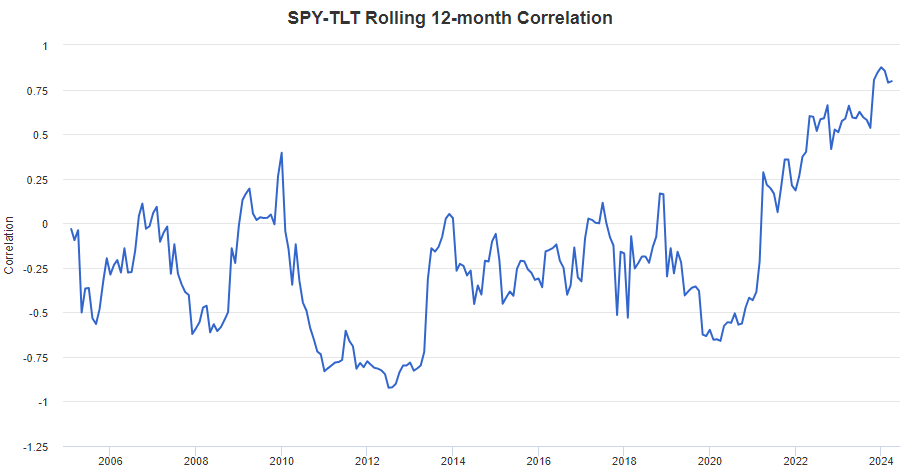
Looking only at the average correlation over the entire period, the two have nearly zero correlation with a reading of -0.12%.
Historically, there has been a wide range of correlation between stocks and bonds with a low reading of -0.92 and a high of 0.88. Knowing that correlation changes over time allows a better understanding of the statistic without being misled by the simple average.
Bull Bear Correlation
Bull Bear has been only moderately correlated to the S&P 500 since inception. From 6/1/2002 to 12/31/2023, the correlation was 0.51.
Like the stock and bond example discussed before, we can expect swings around this average. A tactical manager not only accepts this feature but aims to produce it.
The goal is to have a low, ideal but extremely difficult-to-achieve, negative correlation with the S&P 500 during bear markets such as 2002, 2008, or 2022 when most other assets decline together.
Coming out of these bear markets, we aim to become positively correlated to participate in the gains of a bull market.
This is what produces the swings around the average of 0.51.
Bull Bear Rolling Correlation
To visualize the dynamic nature of the Bull Bear correlation, view the chart below. The blue line is the rolling one-year correlation between Bull Bear and the S&P 500 Total Return Index.
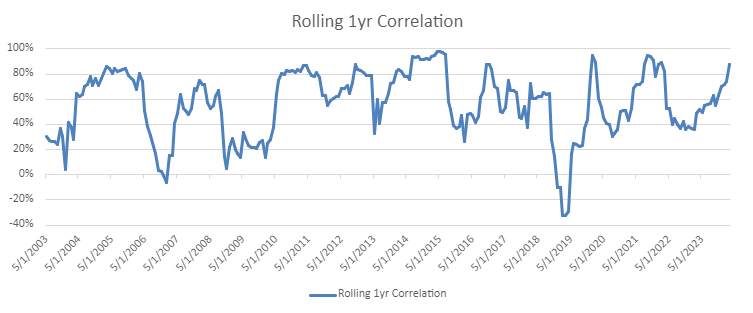
Two extremes can be observed that show the benefits of Bull Bear’s dynamic correlation.
On 2/28/2019, the rolling 1-year correlation was -32.37%. When stocks had multiple sharp declines, Bull Bear became negatively correlated.
The other extreme was on 4/30/2015 when correlation between the S&P 500 and Bull Bear was 97.85%. During this 12-month period, when stocks rose 15%, the strategy became almost perfectly correlated to participate in the gains.
In both scenarios, the tactical strategy performed as designed. During a weak period for stocks, Bull Bear exhibited a negative correlation and was defensive. Conversely, during a stock uptrend, the strategy was nearly perfectly correlated and participated in the gains.
Within traditional buy-and hold portfolios, correlations that change are viewed as negative because it is an unknown variable. Including a strategy such as Bull Bear may reduce the reliance of historical correlations on the overall portfolio.
The willingness to go to cash means that the strategy may become uncorrelated when needed most.
Correlation in Portfolios
Harry Markowitz, the Nobel Prize winning economist said, “diversification is the only free lunch.” The point of his statement being that holding a wide range of assets should offset risk at the portfolio level.
While true in theory, buy-and-hold diversification has failed when investors need it most.
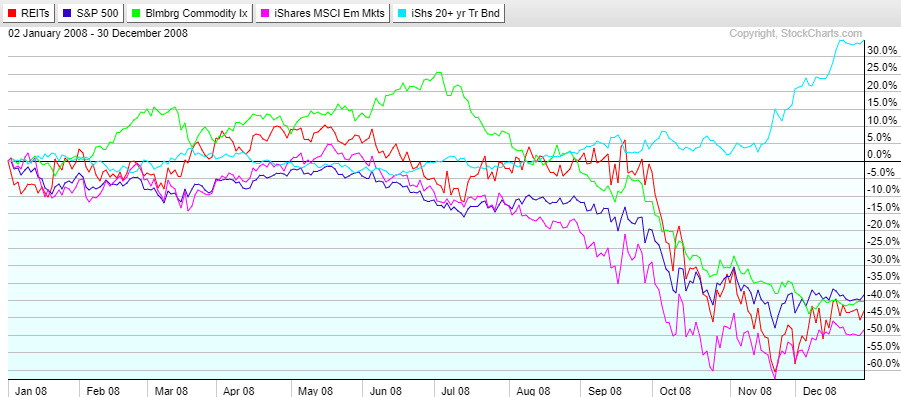
The two examples below show where diversification has failed. Both include a wide range of assets, including REITS, Stocks, Commodities, Emerging Markets, and Bonds.
The first chart is 2008, when the only asset class with a positive return was treasury bonds at +30%.
The chart below is 2022. Correlations rose again as most assets declined together. Commodities were the only positive asset class for the year.
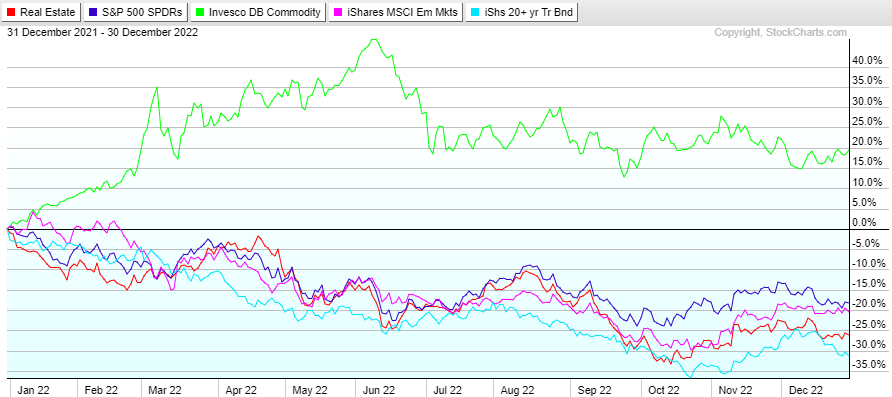
One could argue that diversification worked in both examples, as bonds generated a positive return in 2008, and commodities did so in 2022. However, the odds are that most advisors and investors were predominantly in 60/40 portfolios (stocks/bonds) going into 2022 and had minimal commodity exposure. If that was the case, the lesson was learned that diversification helps until it is needed most.
Final Note
Traditional diversification may be beneficial most of the time but has failed in the outlier years when investors needed risk management most. This overreliance on historical correlation proved to be painful in 2008 when only bonds offset risk and again in 2022 as stocks and bonds declined together.
Tactical risk management aims to minimize the reliance on historical correlations in the portfolio by adding cash as a defensive option.
At Potomac, risk is top of mind; hence the name of our funds, Conquer Risk. Like Bull Bear, all our strategies manage risk through quantitatively tested systems, not with the hope that an asset we own will become negatively correlated to stocks during a bear market.
*All charts are from Portfolioivsualizer.com, StockCharts.com and Excel as of 5/2/2024.
Disclosure: Potomac Fund Management (“Company”) is an SEC-registered investment adviser. This information is prepared for general information only and should not be considered as individual investment advice nor as a solicitation to buy or offer to sell any securities. This material does not constitute any representation as to the suitability or appropriateness of any investment advisory program or security. Please visit potomacfund.com/disclosures. The company does not make any representations or warranties as to the accuracy, timeliness, suitability, completeness, or relevance of any information prepared by any unaffiliated third party, whether linked to the Company website or incorporated herein, and takes no responsibility for any of this information. The views of the Company are subject to change and the Company is under no obligation to notify you of any changes. Different types of investments involve varying degrees of risk, and there can be no assurance that the future performance of any specific investment or investment strategy will be profitable or equal to any historical performance level.
Performance results reflect the composite performance of all fully discretionary portfolios managed by Potomac according to the strategy subject to policies that may require the exclusion of certain accounts. All returns are time-weighted and reflect the reinvestment of dividends and capital gain distributions. Net performance reflects the deduction of a model fee (the highest investment advisory fee charged by Potomac), underlying fund management fees, other fund (administrative) expenses and, if any, redemption or 12b1 (fund marketing) fees. Net of fee returns are calculated using a model fee of 2.5%. The model fee, applied monthly, is the highest fee that may be or has been charged to an investor in this composite. Actual investment advisory fees incurred may vary. Past performance does not guarantee future results. There is no guarantee that any investment strategy or account will be profitable or will avoid loss. Individual investors’ objectives, financial situations, their specific instructions, or restrictions on investments, or the time at which an account is opened, or additions are made may result in different trades and returns. Performance for the strategy presented may differ materially (more or less) from the performance of the comparable benchmark and other Potomac investment strategies. Market and economic conditions could change in the future producing materially different returns. Results do not reflect the impact of taxes for taxable accounts or their owners. You cannot invest directly in an index. This presentation is supplemental to the composite report. The Annual GIPS® Report is available upon request. GIPS® is a registered trademark of CFA Institute. CFA Institute does not endorse or promote this organization, nor does it warrant the accuracy or quality of the content contained herein.
Important Definitions Used in this Report
S&P 500 Index TR: The S&P 500 TR index is a basket of 500 stocks that are considered to be widely held. The S&P 500 Index TR is weighted by market value, and its performance is thought to be representative of the stock market as a whole. The S&P 500 Index TR is one of the most commonly used benchmarks for the overall U.S. stock market. S&P 500 TR is a total return index adjusted for distributions (i.e., assuming that all distributions are reinvested).
Correlation: Correlation is a statistical measure that determines how assets move relative to one another.
PFM-328-20240521