

The 10-Year – 2-Year Yield Curve has finally un-inverted. We have written and said many times that the inversion is not the warning sign for a recession, but rather the un-inversion. It is important to note that a recession is an economic phenomenon, and we are primarily concerned with price action in asset markets. Does a recession mean the stock market must crash? Not necessarily. However, it is safe to say that there is a greater risk of drawdowns and/or increased volatility ahead.
The Curve
The 10-Year – 2-Year Yield Curve is simply the difference between the yield on the 10-Year Treasury Bond and the 2-Year Treasury Bill. Under “normal” conditions, the difference is positive, reflecting the greater risk of lending money for ten years vs. lending money for two years. The curve has been negative, or inverted, since mid-2022… until now.
The shaded areas represent recessions in the U.S. Note that the past four recessions have begun after the curve has moved back to a positive, or un-inverted, position.
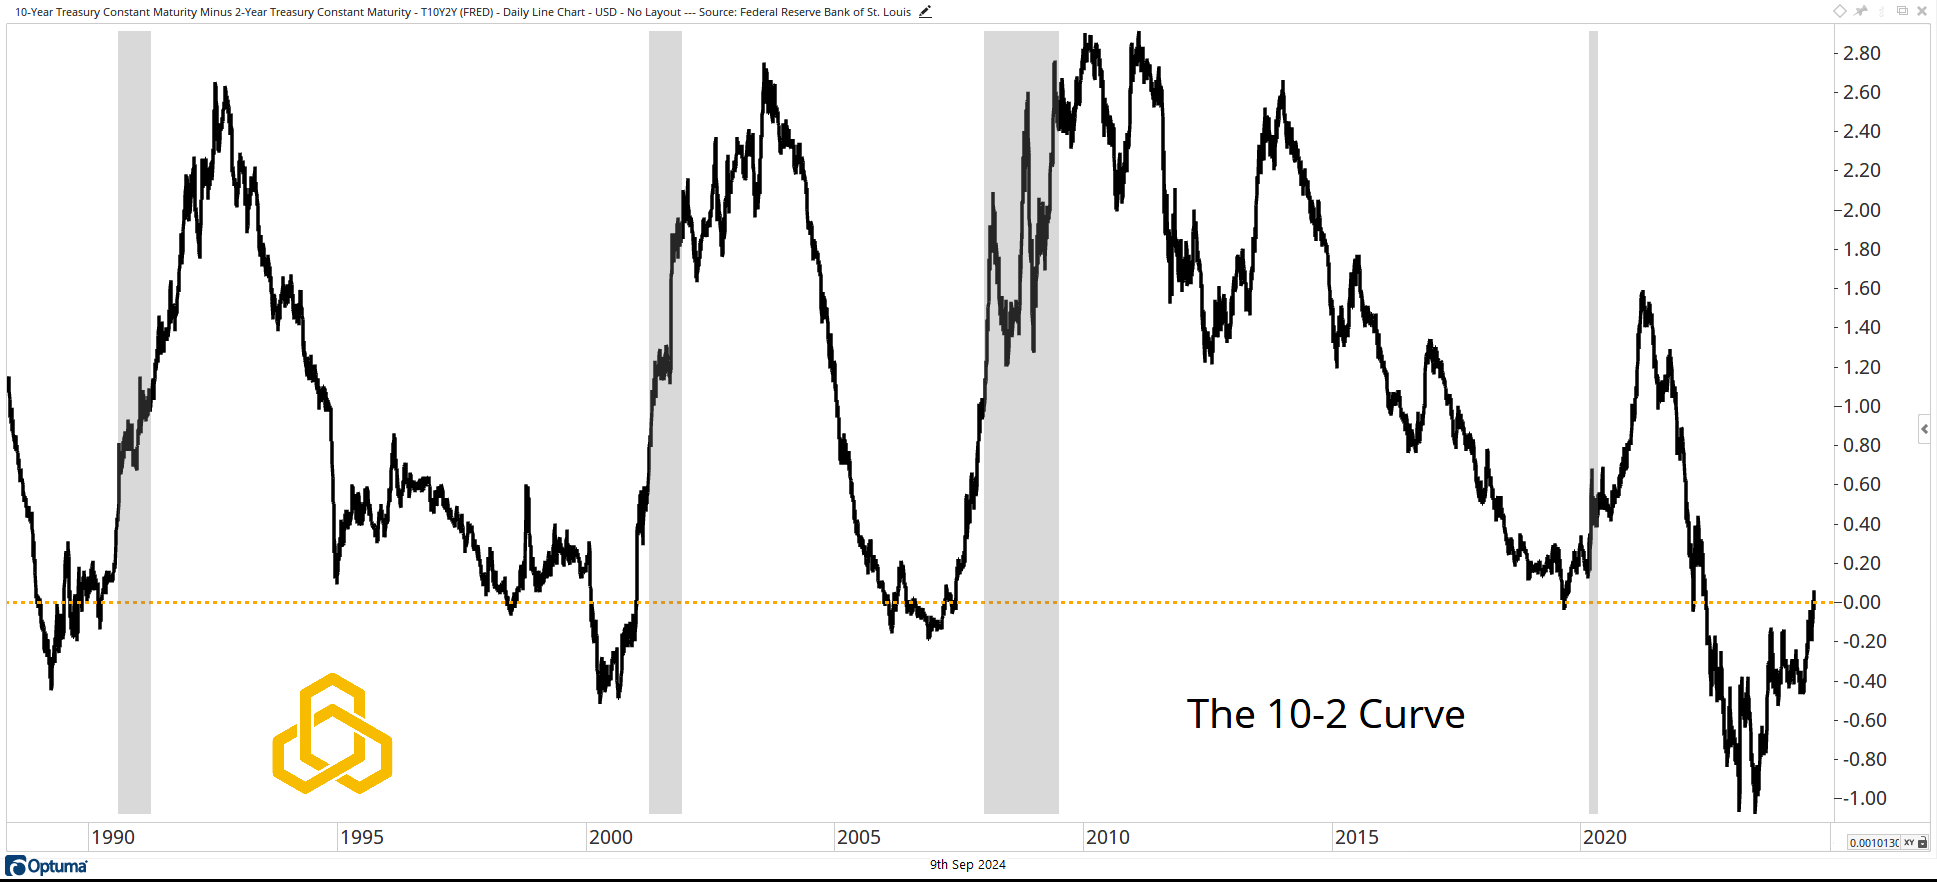
Source: Optuma
S&P 500 Performance
If an investor chose to buy the S&P 500 after the curve un-inverted, and held the position for six months, their average return would be 2.06%. While this does not sound like something to cause major concern, we want to highlight that the column that deserves the most attention is the one labeled MAE. This is the maximum adverse excursion, which is a fancy way of highlighting the deepest drawdown an investor would experience during the holding period.
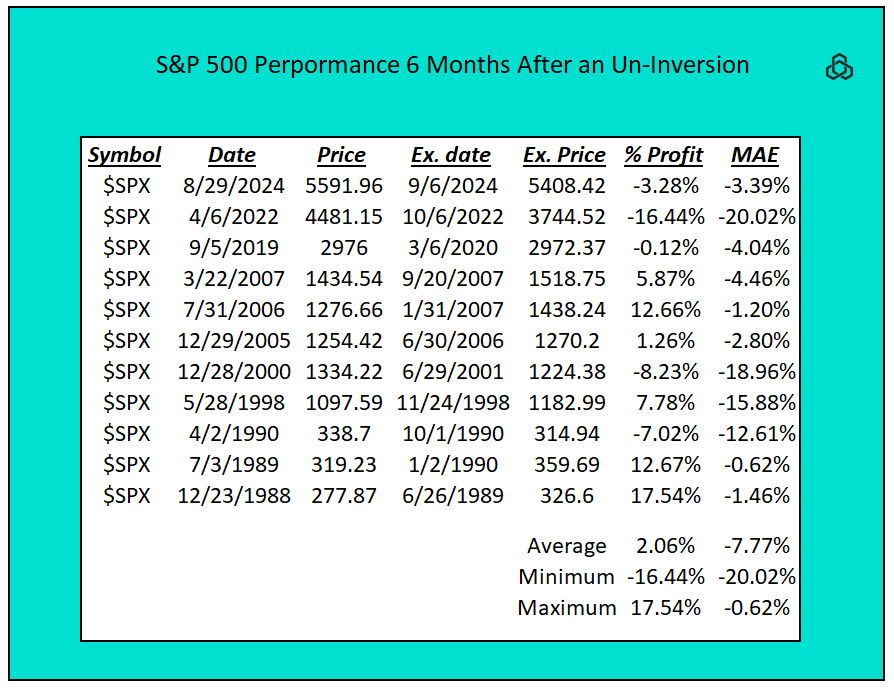
Data: Norgate from 1988 - Present
Sector Performance
Six-month S&P 500 sector performance is already reflecting increased odds (but not a guarantee) of a more challenging environment. The top three performing sectors of the market — Utilities, Consumer Staples, and Real Estate — are usually considered for their defensive properties. Note that Staples and Real Estate were the only sectors to close higher last week.
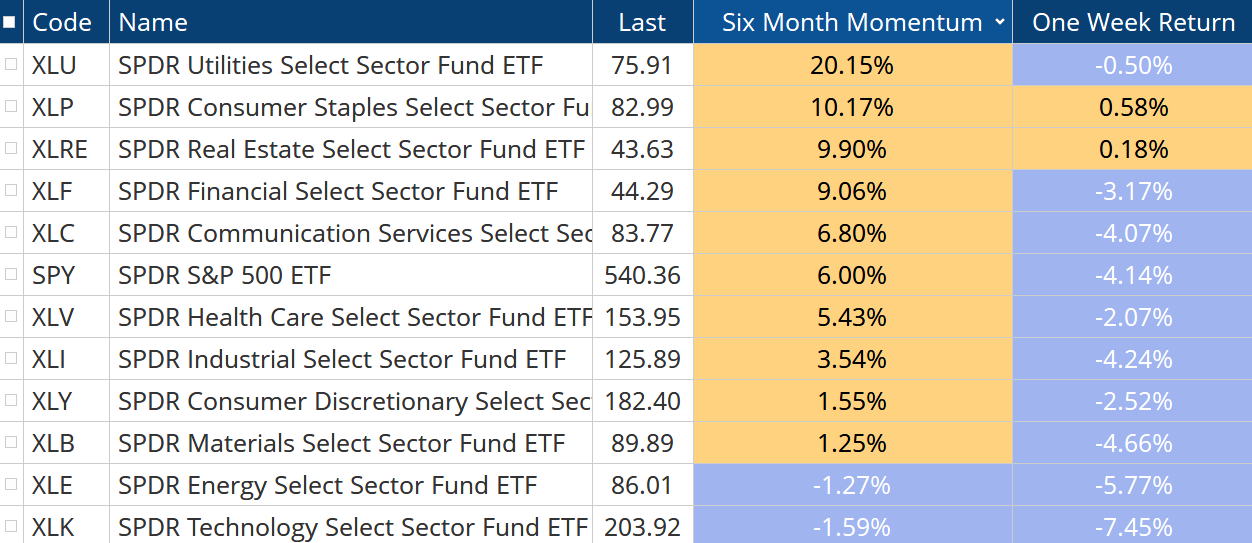
Data: Optuma
The 10-Year Treasury Bond
It is safe to say that the 10-Year Treasury Bond will receive a lot more attention in the days/weeks ahead. Zooming out to a weekly chart, we can see the bond is turning upward (yield turning lower) and trading above the rising 40-week moving average (the yield trades below the 40-week moving average).
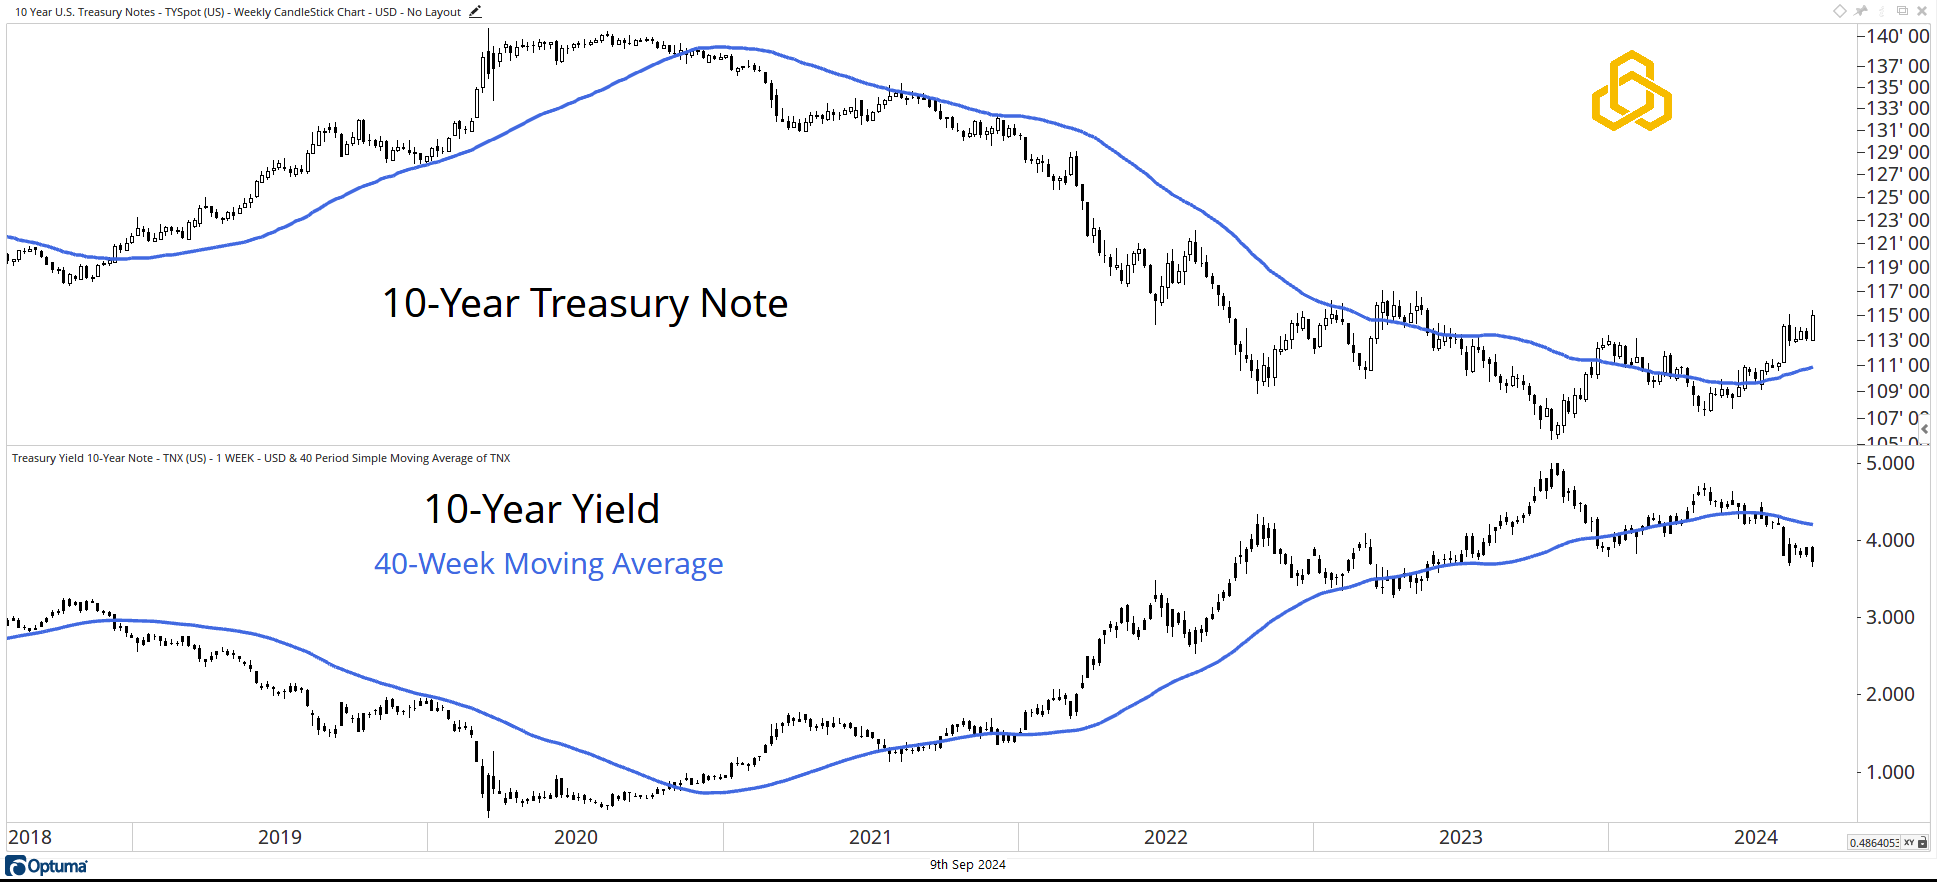
Source: Optuma
Disclosure: This information is prepared for general information only and should not be considered as individual investment advice nor as a solicitation to buy or offer to sell any securities. This material does not constitute any representation as to the suitability or appropriateness of any investment advisory program or security. Please visit our FULL DISCLOSURE page.
PFM-354-20240909