

Assuming you know how to swim, if I dropped you a mile into the ocean and said, “swim to shore,” the most conducive environment for reaching land quickly would be one where the tide, waves, and wind were working in your favor. In order of importance: the tide would be rising, you would time your strokes to paddle hard as new waves were forming, and the wind would be at your back.
The stock market works much the same way, and the current environment has the tide working against bullish investors. This is a time to conserve energy and only exert effort during the brief instances when the waves are moving toward the shore and there is some help from the wind.
S&P 500
The S&P 500 closed below the 60-week moving average for a fourth consecutive week. That moving average is now trending lower. If we return to the ocean swimming analogy, the tide is against the bulls. Logically, it is easier for the market (our swimmer) to make forward progress when the index is above a rising 60-week average. When the index is below a falling average, it makes more sense to wait for opportune moments to advance.
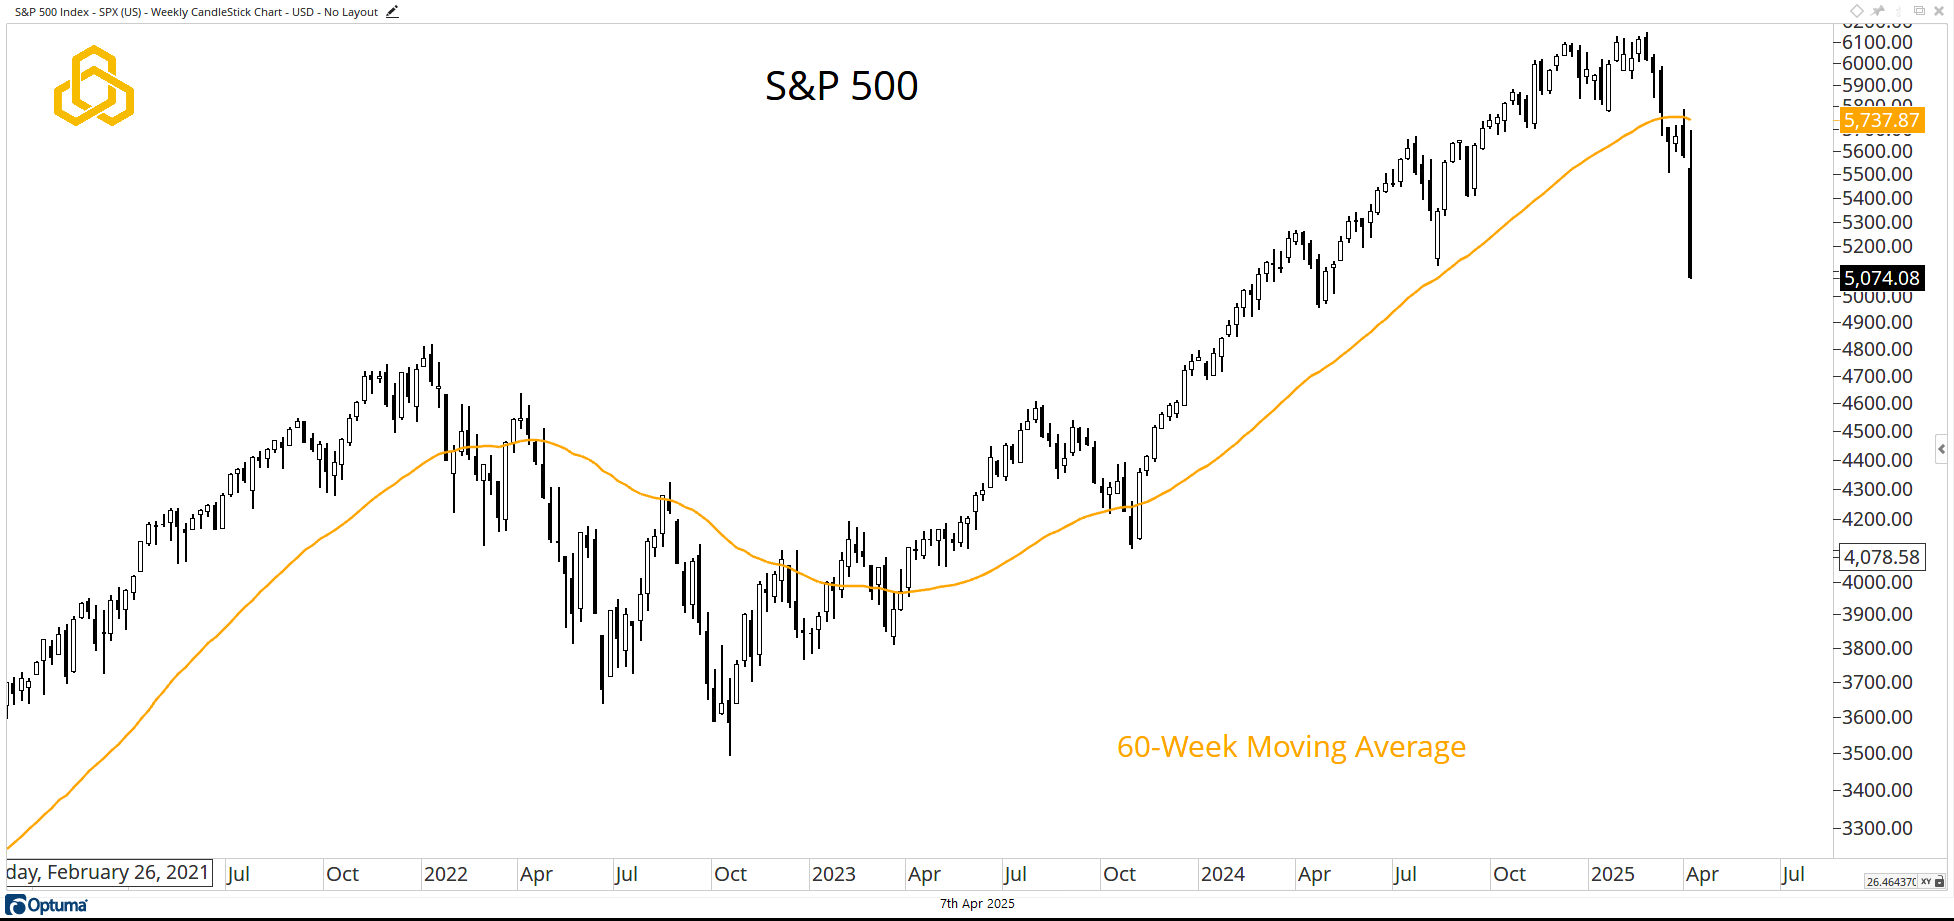
Source: Optuma
Dow Jones Transportation Average
The Dow Transports, frequently featured in these pages, provide further evidence that the tide is not in the bulls’ favor. The average came under additional pressure last week and now sits well below the declining 27-week moving average.
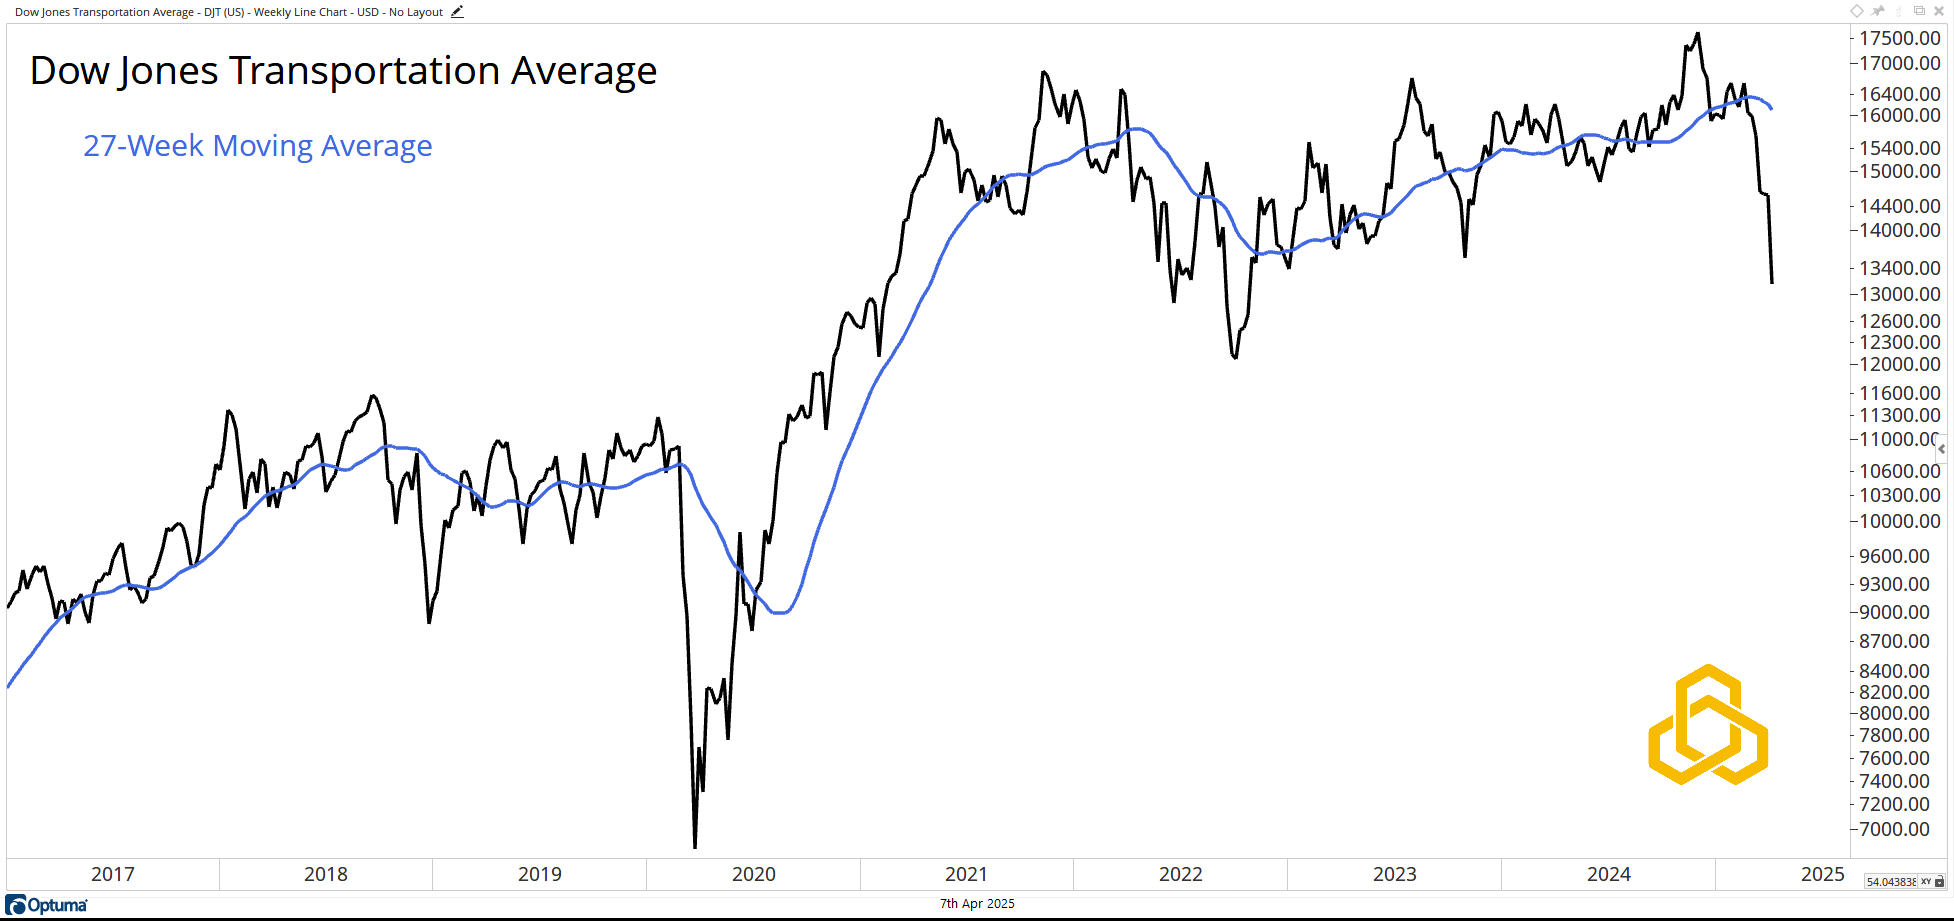
Source: Optuma
If you're a swimmer in the ocean, the best strategy when the tide is falling is to conserve as much energy as possible. Intensely paddling against the tide is a sure-fire way to burn energy while making little progress. In this environment, the swimmer must be more selective about when to expend energy. The best chances to make headway will come by timing the waves, which continue to rhythmically ebb and flow despite the unfavorable tide. A slight tailwind would also help.
In the market, this means looking for moments within the broader declining trend where stocks may have fallen too far, too fast, and could be poised for a countertrend move.
CBOE S&P 500 Volatility Index (VIX)
Often referred to as the market’s fear gauge, the VIX rises as stocks fall and falls as stocks move higher. The index closed the week above 45, its highest closing level since 2020. As I write (6:35 a.m.), the VIX is at 49—down from 60 earlier this morning.
The VIX tends to ebb and flow like waves in the ocean. Sometimes the waves are large; other times, they are smaller. Spikes tend to be short-lived and often signal that the market has become oversold in the short term and may be poised for a rally.
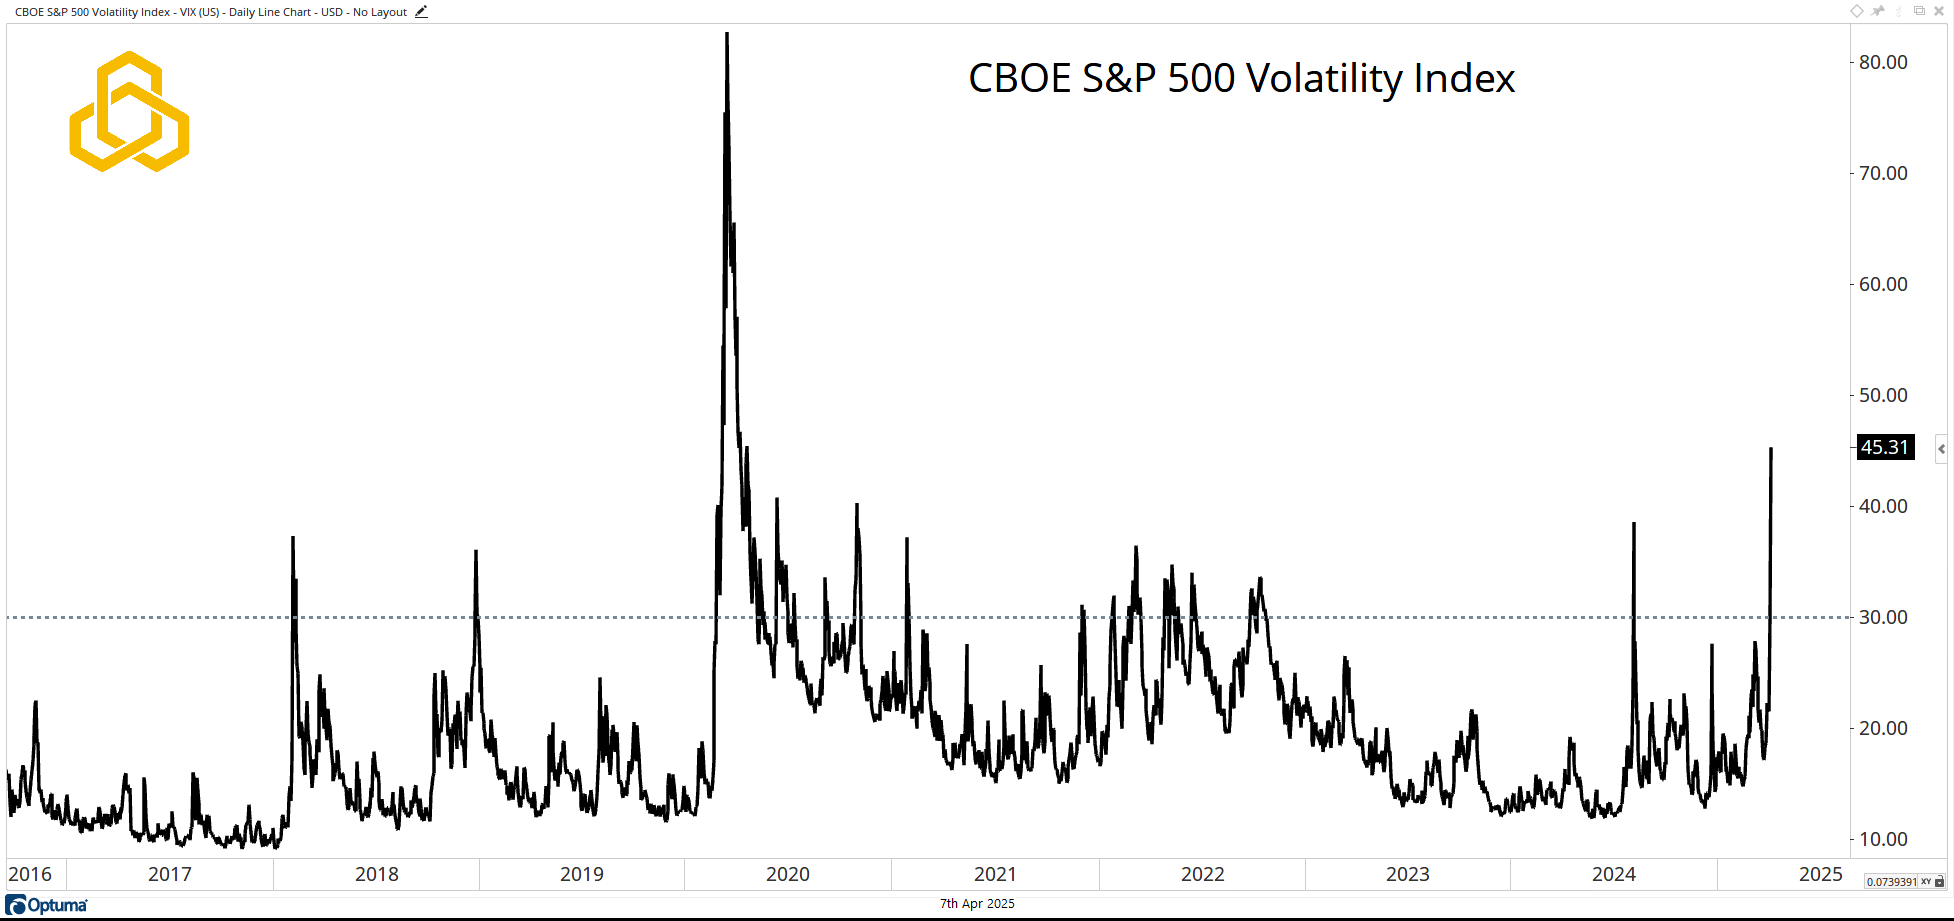
Source: Optuma
S&P 500 Percentage Above 20-Day Moving Average
Now, let’s move on to the wind—arguably the least impactful of the three factors for the swimmer, but still worth noting.
In the market’s case, we’ll use the percentage of stocks in the S&P 500 that are above their respective 20-day moving averages (note: this is not part of our formal process, but it’s interesting nonetheless). Like the wind, this metric changes direction quickly. The current reading is 5.77%. I’ve marked the chart of the S&P 500 with instances over the past 10 years when this metric fell below 10%.
This is by no means a perfect signal, but sub-10% readings have tended to cluster near local lows for the index. Yes, 2020 was the notable exception, as prices continued to move lower.
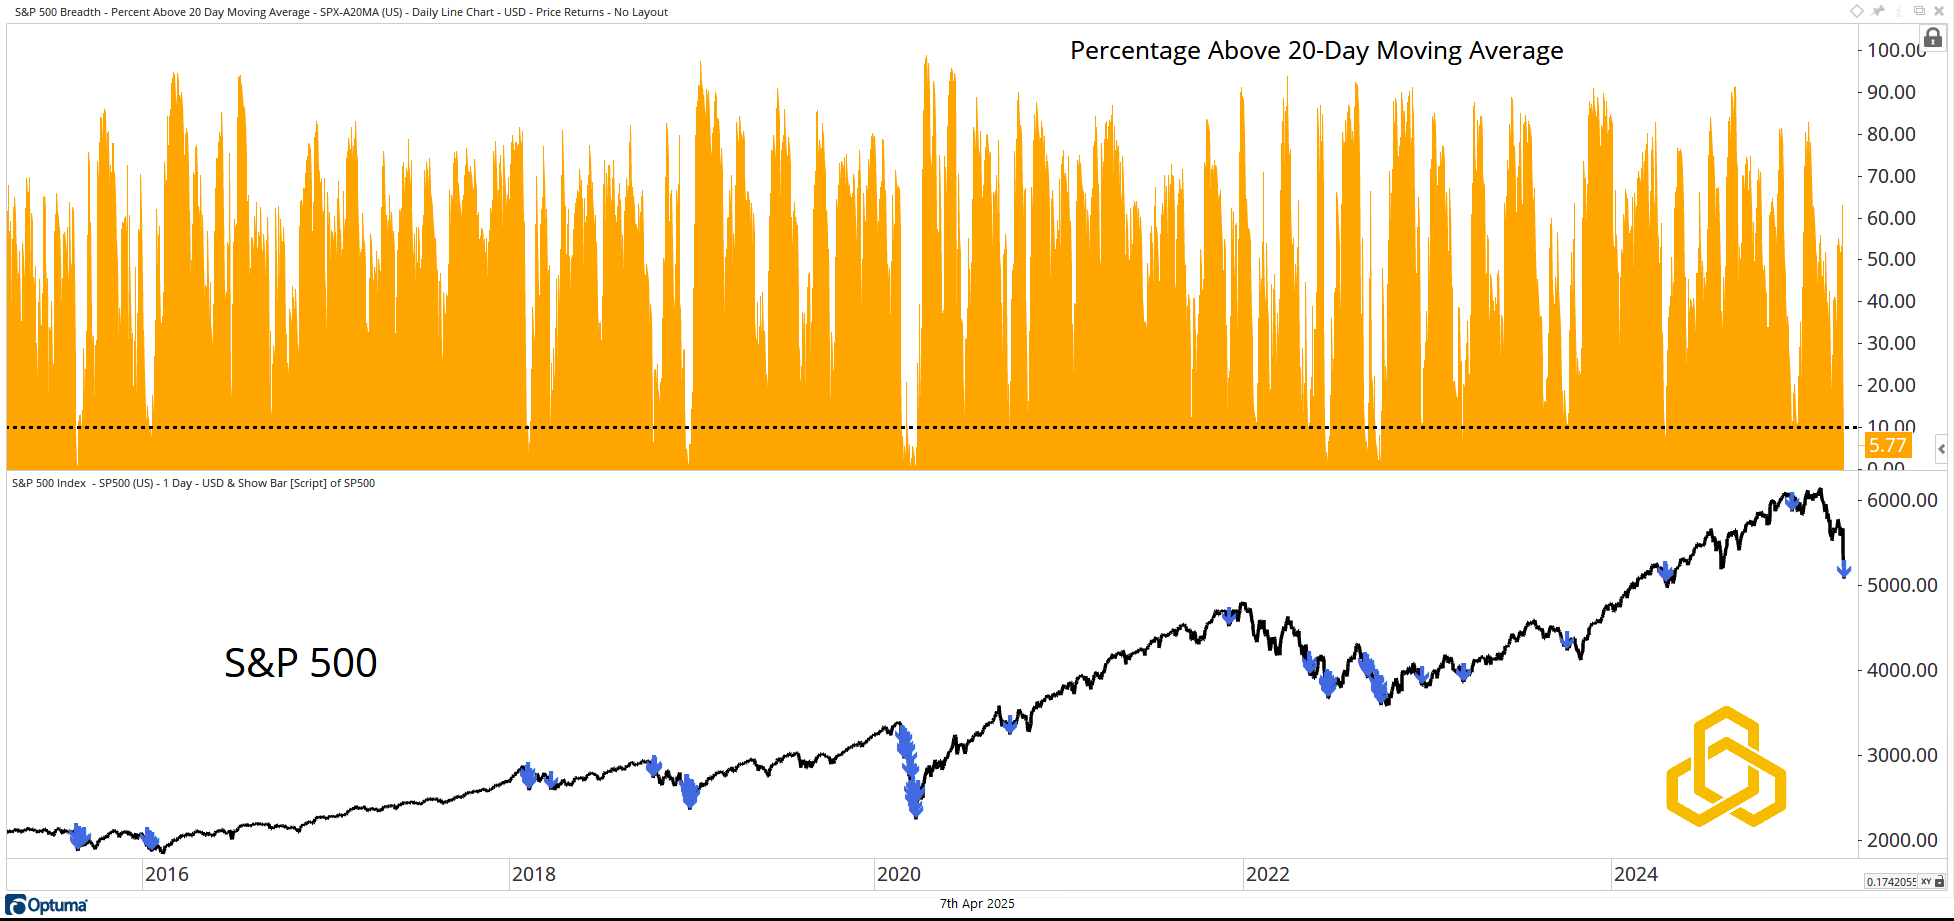
Source: Optuma
The tide is working against investors, but the waves and the wind are possibly in a position where some progress can be made.
Disclosure: This information is prepared for general information only and should not be considered as individual investment advice nor as a solicitation to buy or offer to sell any securities. This material does not constitute any representation as to the suitability or appropriateness of any investment advisory program or security. Please visit our FULL DISCLOSURE page.
PFM-309-20250407