
Background and Overview
There are hundreds of indicators that are common to anyone familiar with technical analysis. Historically, these indicators have been used subjectively, as most were designed before computers existed. The problem is that when these indicators are used traditionally, most don’t test well under the scrutiny of quantitative analysis.
The stochastic oscillator was designed by George Lane in the 1950s. Investopedia defines it as “a momentum indicator comparing a particular closing price of a security to a range of its prices over a certain period of time.”
The oscillator is bounded from 0-100 and measures the location of the current closing price relative to the high and low range of prices over some period. Traditionally, the period is 14 days.
Calculation
There are three parts to calculate the stochastic:
The current closing price.
The lowest price over x days.
The highest price over x days.
First, a range of all prices is made over the prior 14 trading days by subtracting the 14-day low from the 14-day high. Next, the distance from the low is found by subtracting the 14-day low price from the current closing price. That number is then divided by the total range of prices and multiplied by 100 to give the percentage that the current closing price is relative to the 14-day range.
C = Current closing price.
L14 = Lowest price over the prior 14 trading days.
H14 = Highest price over the prior 14 trading days.
Stochastic = (C – L14 ) / ( H14 – L14 ) * 100
Simply put, a 50% reading of the stochastic means that the current price is exactly in the middle of its range over the prior n days.
Likewise, a 100% reading means the current price is at the highest level over the past n days.
Visual
The chart below shows the S&P 500 Index and its first 14 trading days of 2024. To calculate the stochastic based on this data, we note that the highest price was 483.72, and the lowest price was 464.99. Then, we use the formula above with the current closing price of 481.95 to compute the stochastic of 90.55.
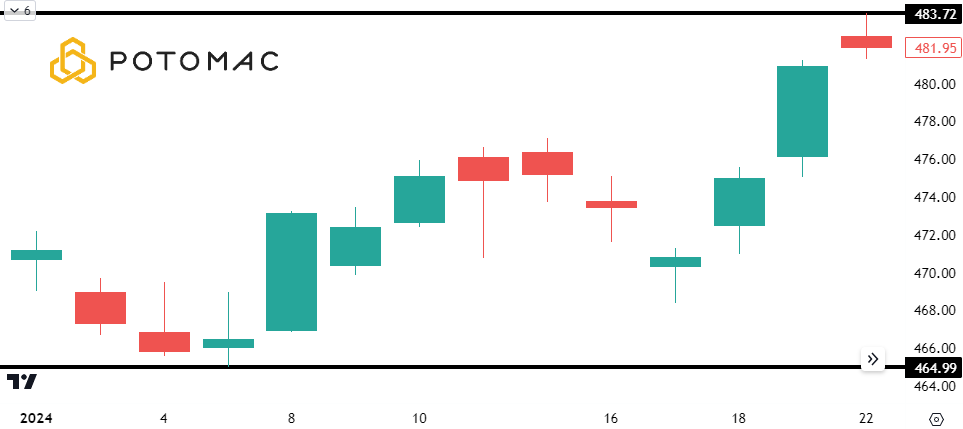
The indicator tells us that the S&P 500 current closing price is greater than 90.55% of all other prices over the last 14 trading days.
Common Trading Rules
The traditional way to use the stochastic indicator is to form overbought and oversold levels, which are 80 and 20, respectively.
A stochastic of less than 20 gives a buy signal, and a stochastic over 80 is a sell.
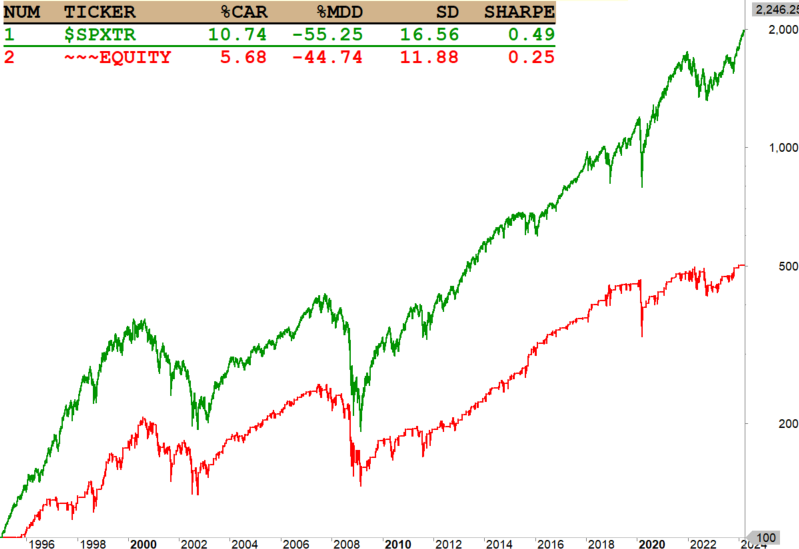
Below is a test on the S&P 500 index reflecting these rules:
Buy when the stochastic crosses below 20.
Sell once it goes above 80.
The green line is the S&P 500, and the red line is the simulation.
The next common method is to create a three-day moving average of the stochastic and use that as a trigger to create buys and sells.
The rules for the test below are this:
Buy when today’s stochastic is greater than the three-day average stochastic.
Sell when the opposite is true.
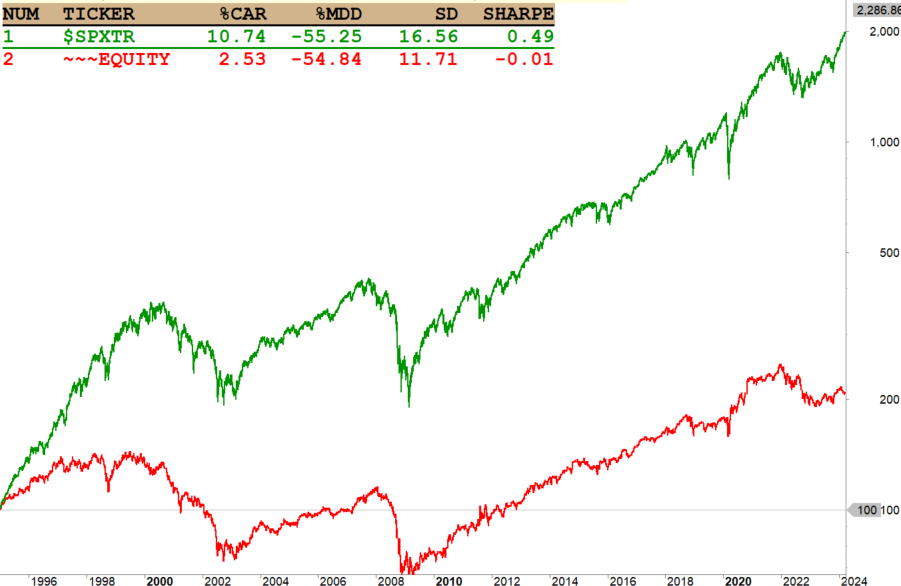
These two examples demonstrate that quantifying traditional technical indicators may yield different results than expected. In this case, both methods for stochastic trading systems have proven to be poor systems in the past.
Clearly, improvements are needed.
Potomac Use Case
At Potomac, traditional uses of indicators are tested for their validity. Often, the data shows that indicators are not complete trading systems in isolation. Because of this, we use a composite system that combines various stock market indicators. The stochastic is one of those indicators, albeit repurposed to make it our own.
We use a combination of four stochastic indicators to drive our trading strategy for the NASDAQ 100 Index ETF (QQQ). We use traditional pricing variables and add other variables such as Rate of Change, Exponential Moving Averages, and Standard Deviation.
In some cases, there are predefined exit levels after a trade has been entered; in other cases, we use a specific holding period.
When three indicators give a buy signal, we can take a long position. After entering the market, a sell signal will be generated if only one or two of the indicators remain on a buy signal. If there are no indicators on a buy signal, inverse exposure to the NASDAQ 100 can be taken.
Repurposing the stochastic in this way shows significant improvement when compared to Lane’s outdated set of rules of the ‘50s. However, it still may not be robust enough to act as a standalone strategy. Combining various indicators such as this one ideally creates a composite-based system that aims to be better than any single indicator we test.
*The chart is from TradingView.com, and back test data is from Norgate.com using Amibroker software.
Disclosure: Past performance does not guarantee future results. There is no guarantee that any investment strategy or account will be profitable or will avoid loss. Individual investors’ objectives, financial situations, their specific instructions, or restrictions on investments, or the time at which an account is opened, or additions are made may result in different trades and returns. Performance for the strategy presented may differ materially (more or less) from the performance of the comparable benchmark and other Potomac investment strategies. Market and economic conditions could change in the future producing materially different returns. You cannot invest directly in an index. This presentation is supplemental to the composite report. This information is prepared for general information only and should not be considered as individual investment advice nor as a solicitation to buy or offer to sell any securities. This material does not constitute any representation as to the suitability or appropriateness of any investment advisory program or security. Please visit our FULL DISCLOSURE page.
PFM-329-20240528