

It seems that when Japan sneezes, the rest of the world catches the flu. Such is the case when you rest of the world uses your debt and currency to fund their trading. It is called a carry trade, and to drastically oversimplify it; investors borrow Yen in Japan since the rates there are so low. They convert the Yen to dollars to buy US assets that can be used as collateral to lever portfolios to enhance exposure to high octane parts of the market such as Semiconductors, Software, Internet, Crypto, and you get the point.
However, when the Bank of Japan raised rates recently, that caused a strong move higher in the Yen (the funding currency that speculators are essentially short). In a mad dash to cover, these speculators are forced to reduce exposure to risk assets. This has caused a correction (NASDAQ) from all-time highs despite those highs being confirmed by strong market breadth.
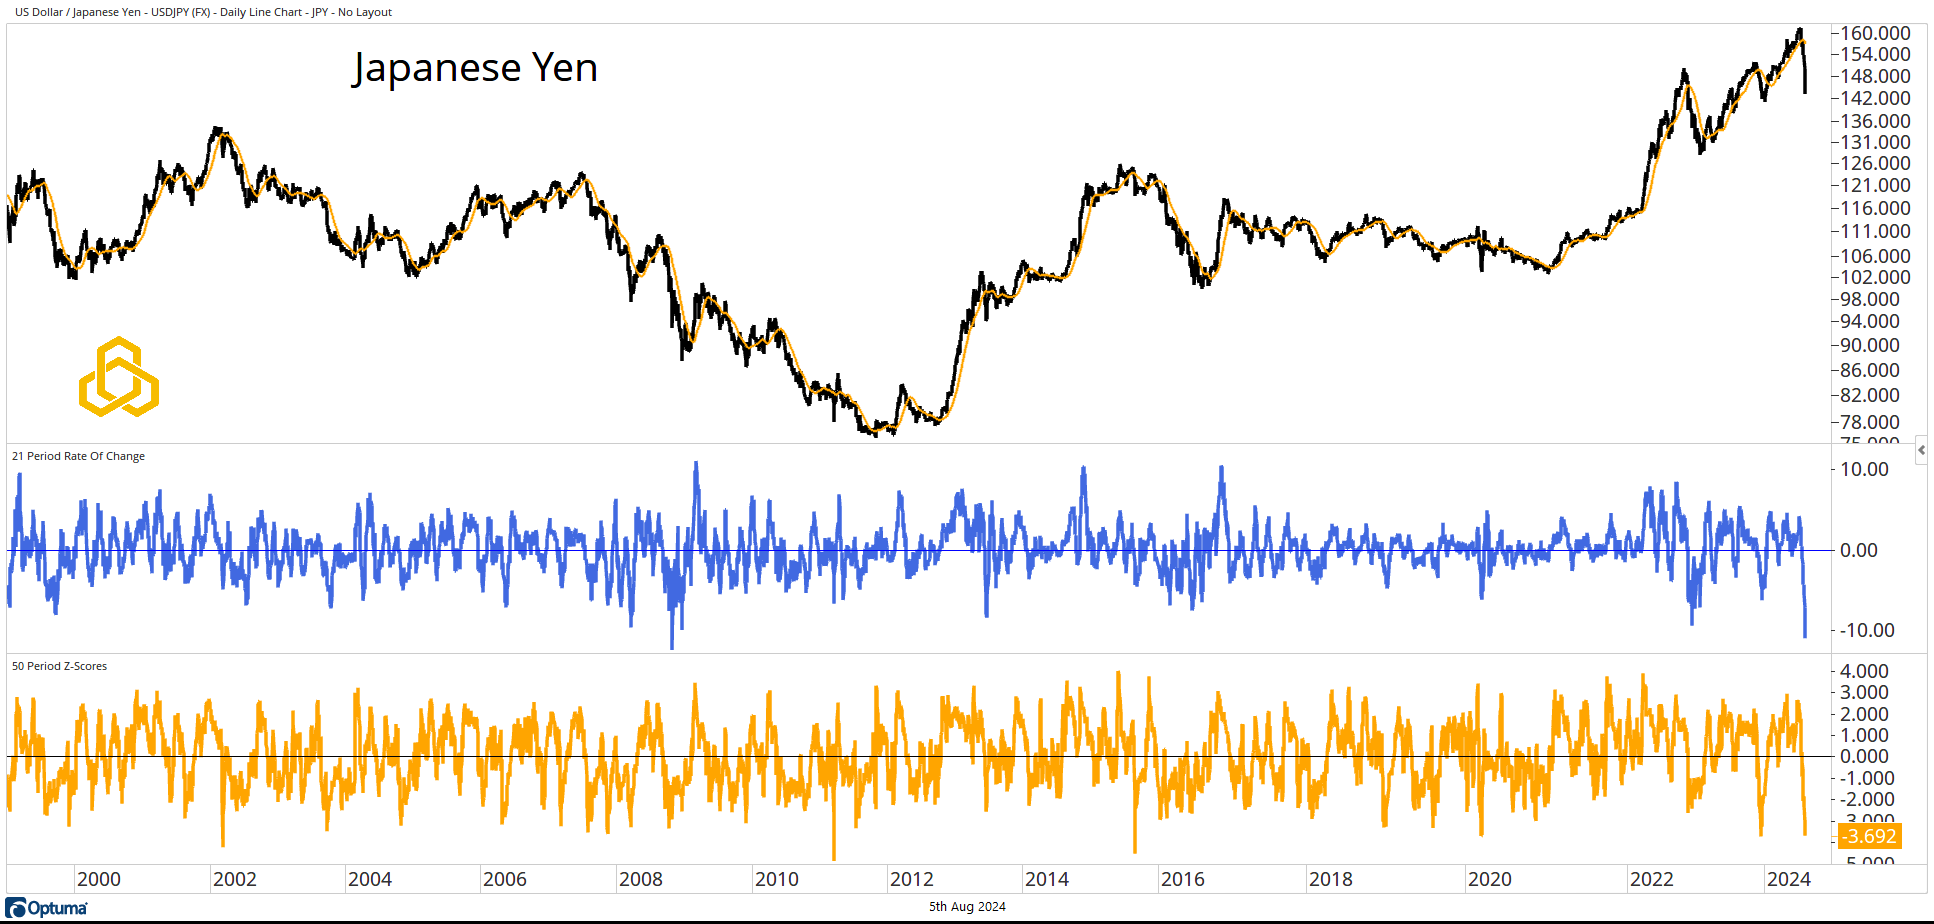
Japanese Yen
The Yen has moved swiftly lower (strength) against the dollar. In fact, this is the second sharpest 21-day strengthening in the past quarter century (middle panel). The 50-day Z-Score is at -3.692 entering today (lower panel). This is a substantial move and the best explanation for the market moving strongly lower from confirmed highs.
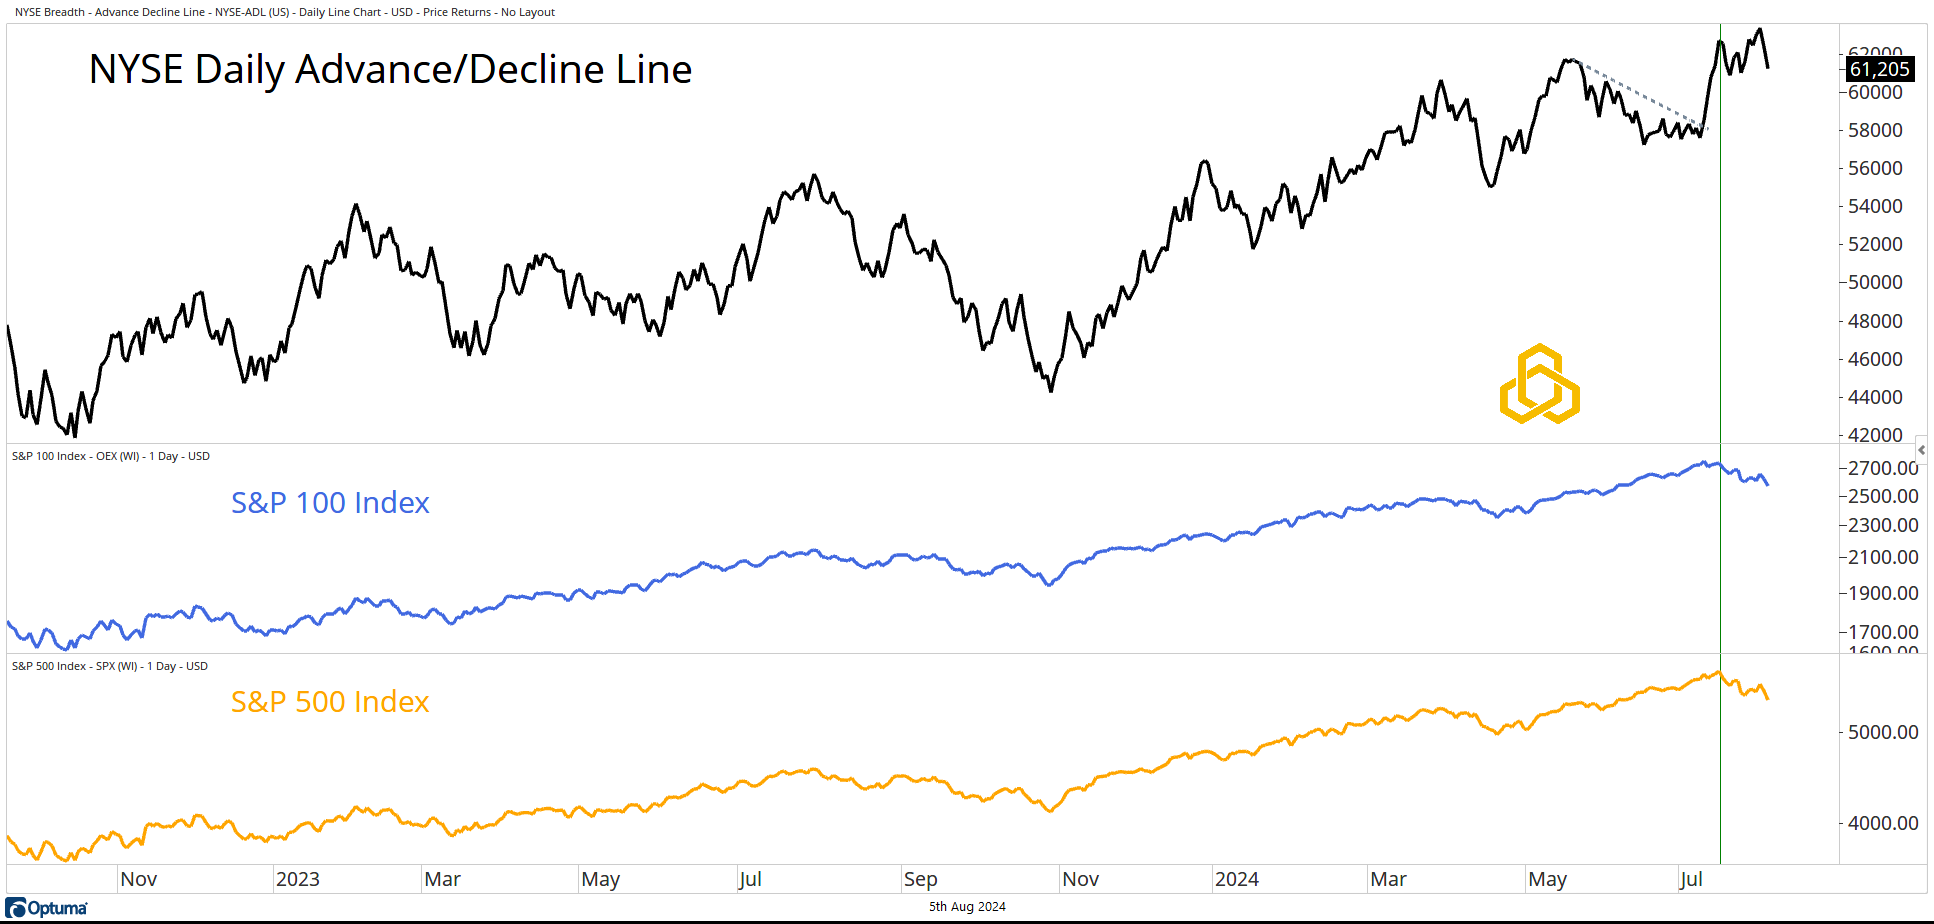
Advance/Decline Data
The Advance/Decline Line for the NYSE made a new high last week, after confirming the new highs for the S&P 100 and S&P 500 (green vertical line) in mid-July. Despite the selling pressure in the indices, we are not seeing major deterioration in the A/D Line.
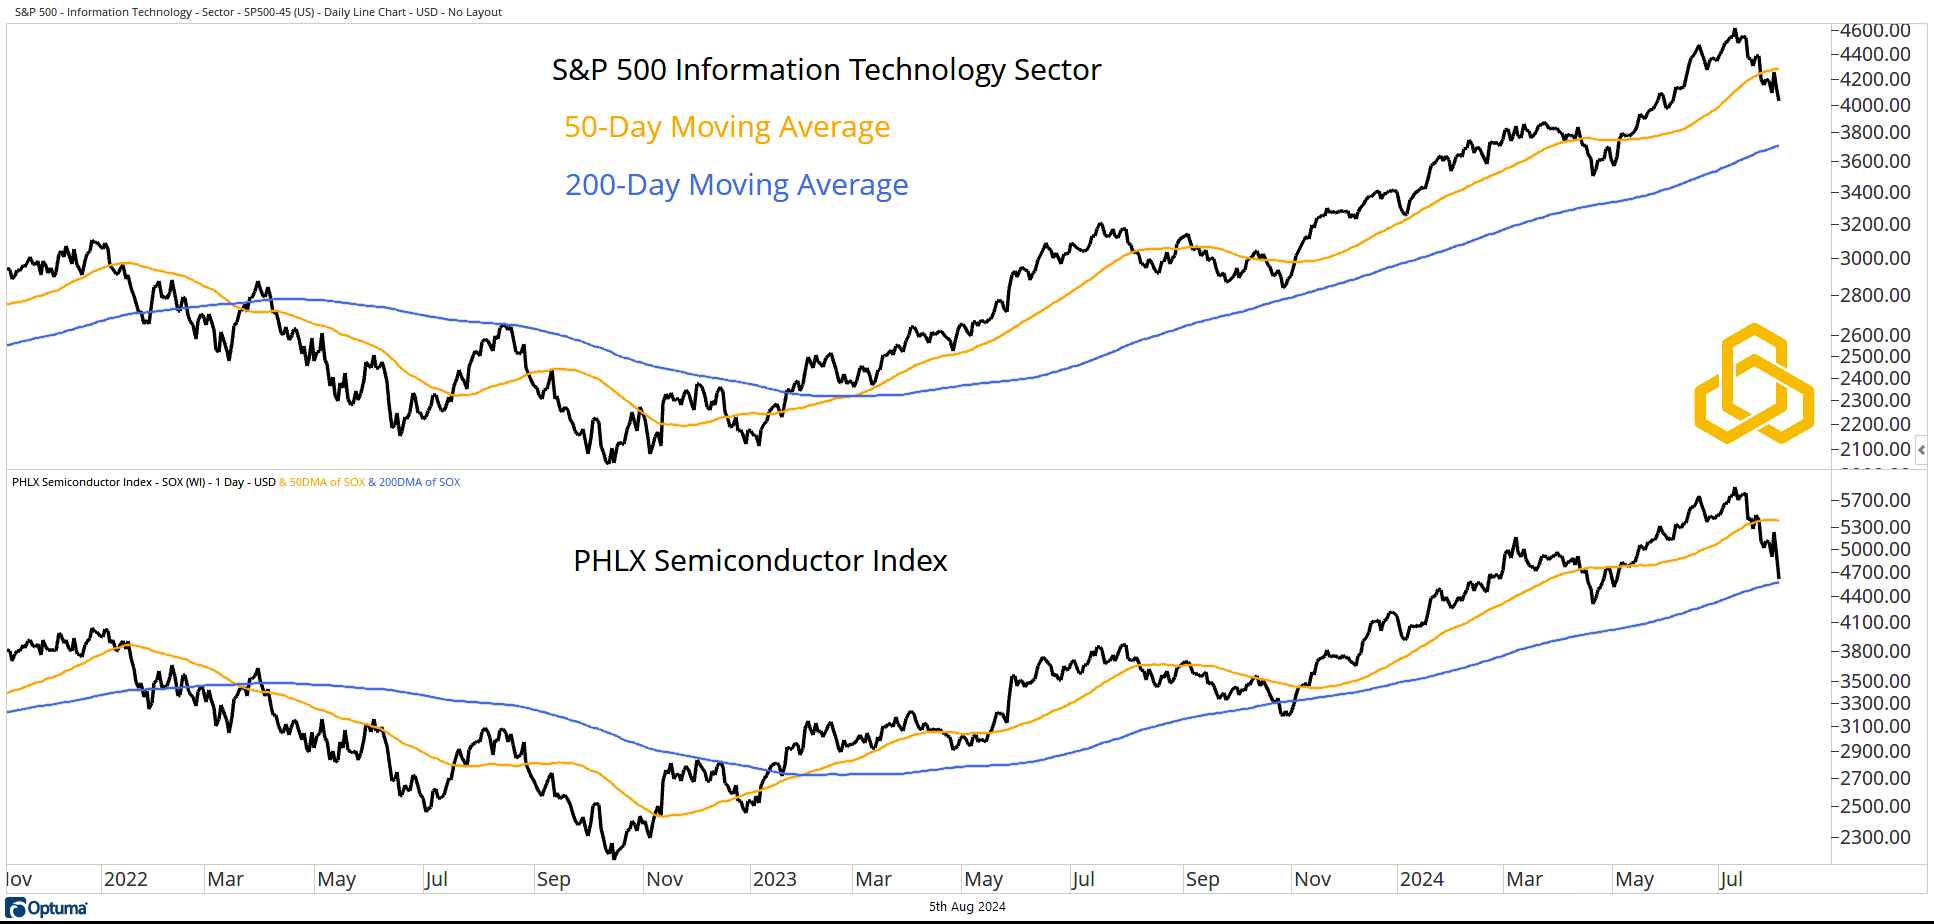
Where is the Selling?
The problem for the market from an index level is “what” is being sold. Speculators did not go through the trouble of running through all the steps of the carry trade just to put leverage on low beta, safe assets. They went for the juice, so now that is what will get squeezed. The Technology Sector is the largest in the S&P 500 and the Semiconductor Industry has been the highflier there. Pain in this part of the market has been enough to overcome bullish breadth elsewhere.
Bulls want to see the Semis hold the 200-day; a dicey prospect based on early Monday trading.
*All charts from Optuma as of the close of trading on August 2, 2024. Past performance does not guarantee future results.
Disclosure: This information is prepared for general information only and should not be considered as individual investment advice nor as a solicitation to buy or offer to sell any securities. This material does not constitute any representation as to the suitability or appropriateness of any investment advisory program or security. Please visit our FULL DISCLOSURE page.
PFM-348-20240805