

We have been unabashed bulls in these pages for some time, which is saying a lot for someone who carries the nickname “Doomsday Dan.” However, the simple fact of the matter has been that the trend in the market has been bullish, and that trend has been healthy based on the various breadth metrics that we track.
This week, our intention is not to be alarmist, but rather to be open to the idea that markets do not increase in a straight line. As we enter the new week, there are some short-term dents that have emerged.
S&P 500 (Daily)
While we normally focus on the weekly time frame here, today we want to highlight the daily. The S&P 500 ticked a new all-time high on Monday, then spent the rest of the week moving lower. After five consecutive days of closes below their opens (black candles), the index has moved back to the post-election opening level.
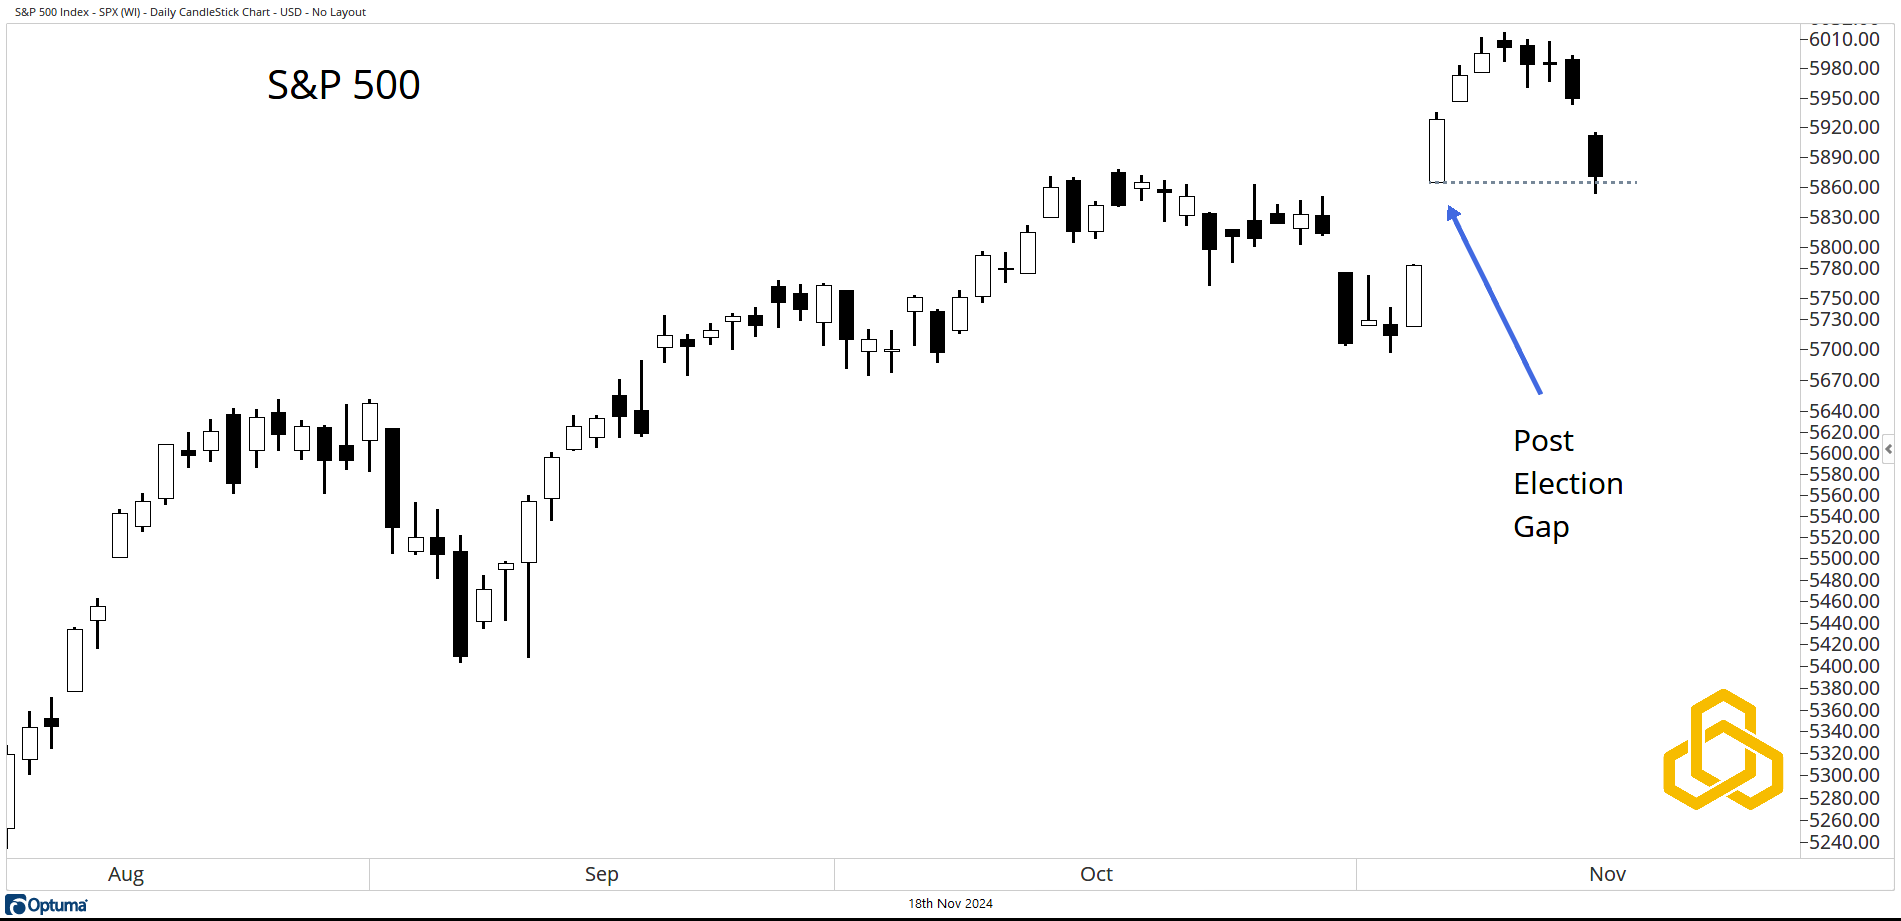
Source: Optuma
NASDAQ Composite vs. S&P 500
The ratio of the NASDAQ Composite Index vs. the S&P 500 Index has turned lower from levels that are nowhere near the July peak. At the same time, the ratio has sliced below the 20-day moving average, signaling near-term risk aversion on the part of investors.
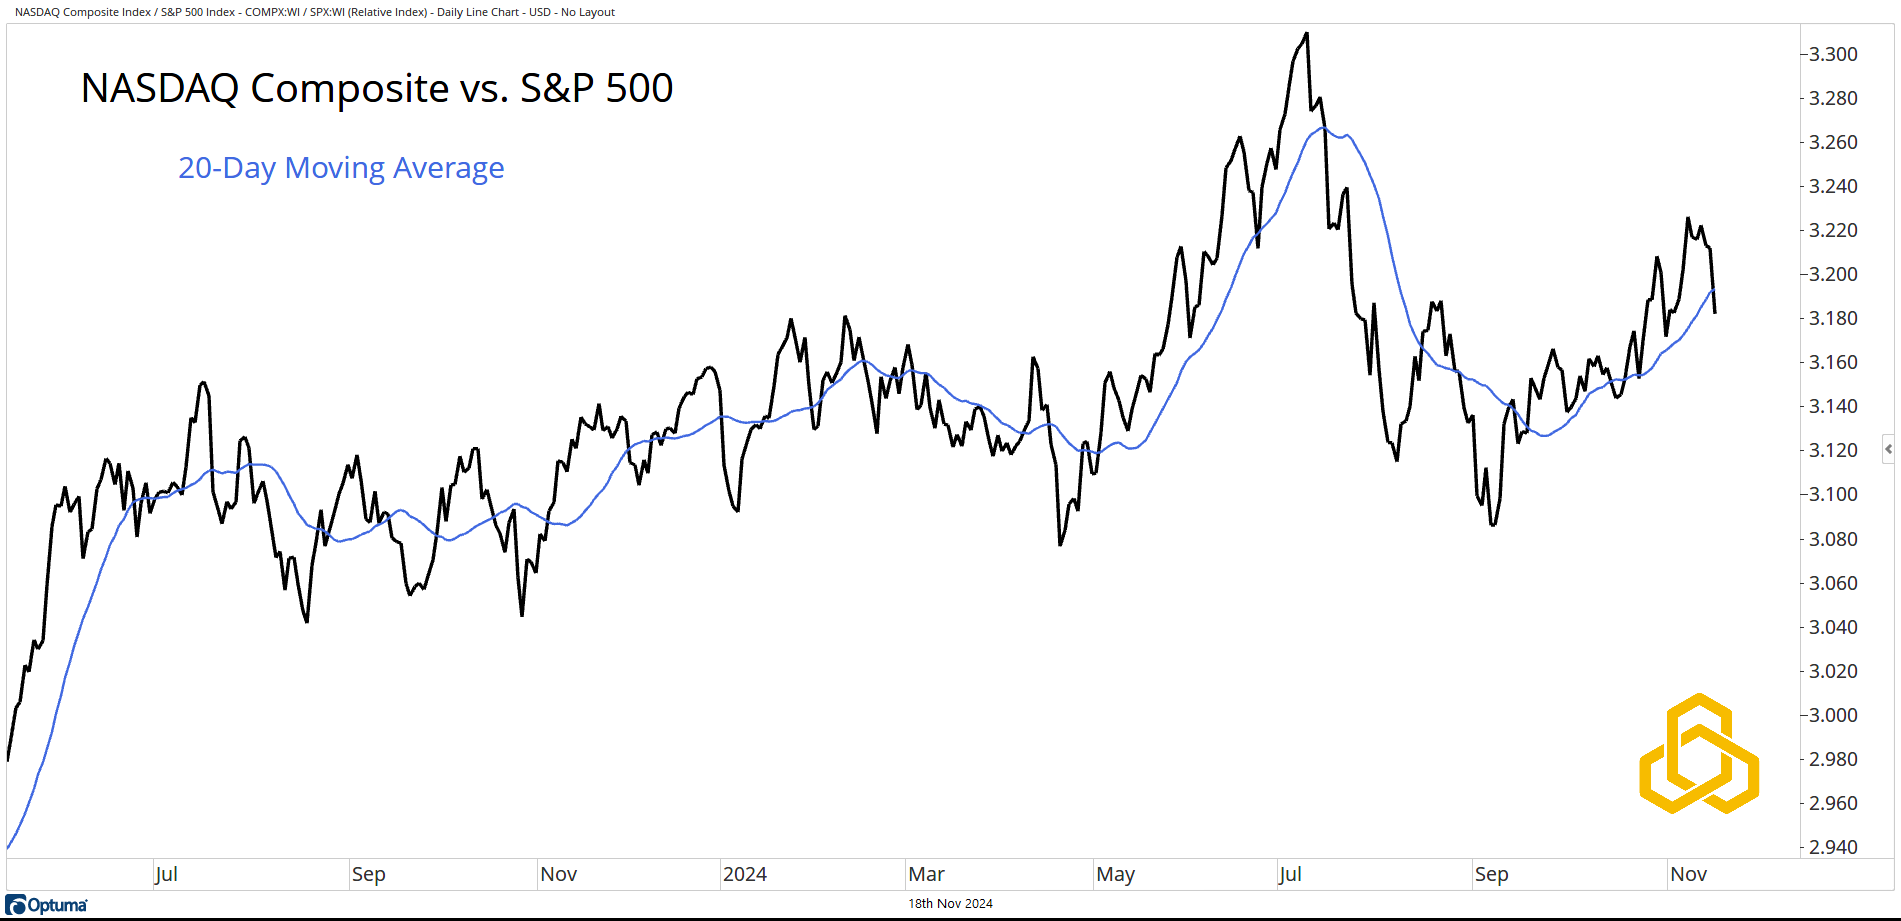
Source: Optuma
Russell 2000: Growth vs. Value
The ratio between the small-cap growth and small-cap value is also fading after failing to reach its July peak. The ratio has cut below the 30-day moving average in another sign of short-term risk aversion in the market.
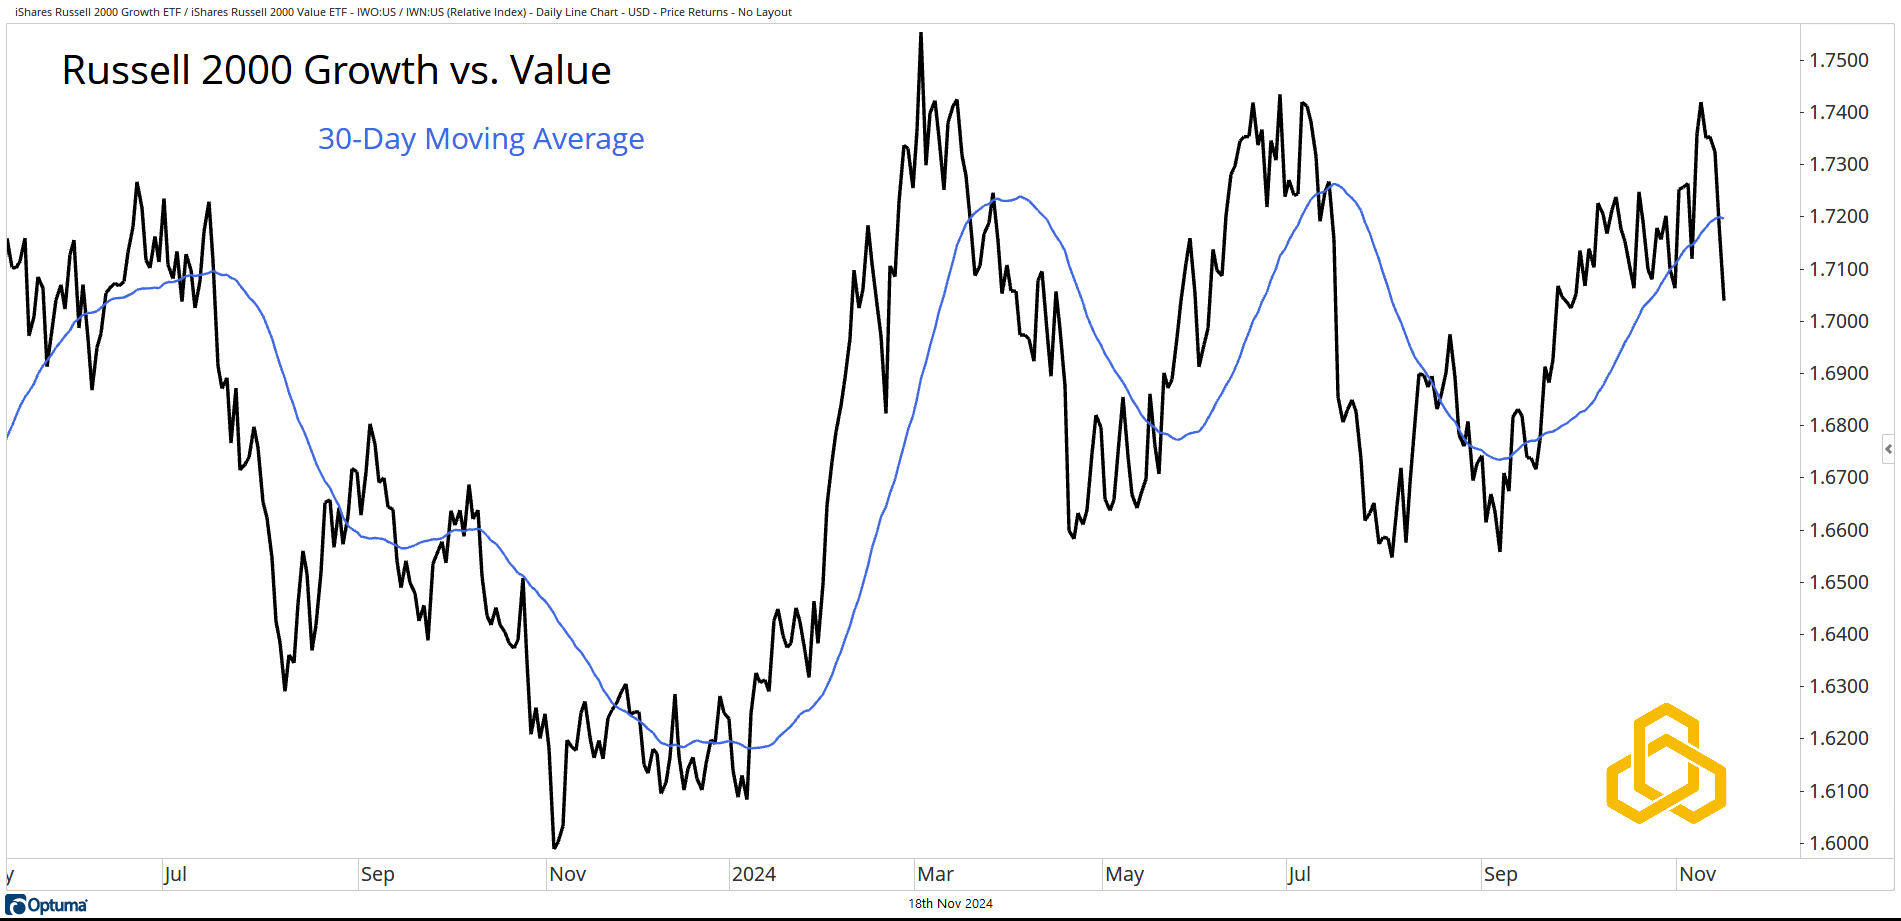
Source: Optuma
S&P 100 vs. S&P 500
The ratio of the S&P 100 Index vs. the S&P 500 Index has also come under near-term pressure, below the July peak, to close below the 10-day moving average.
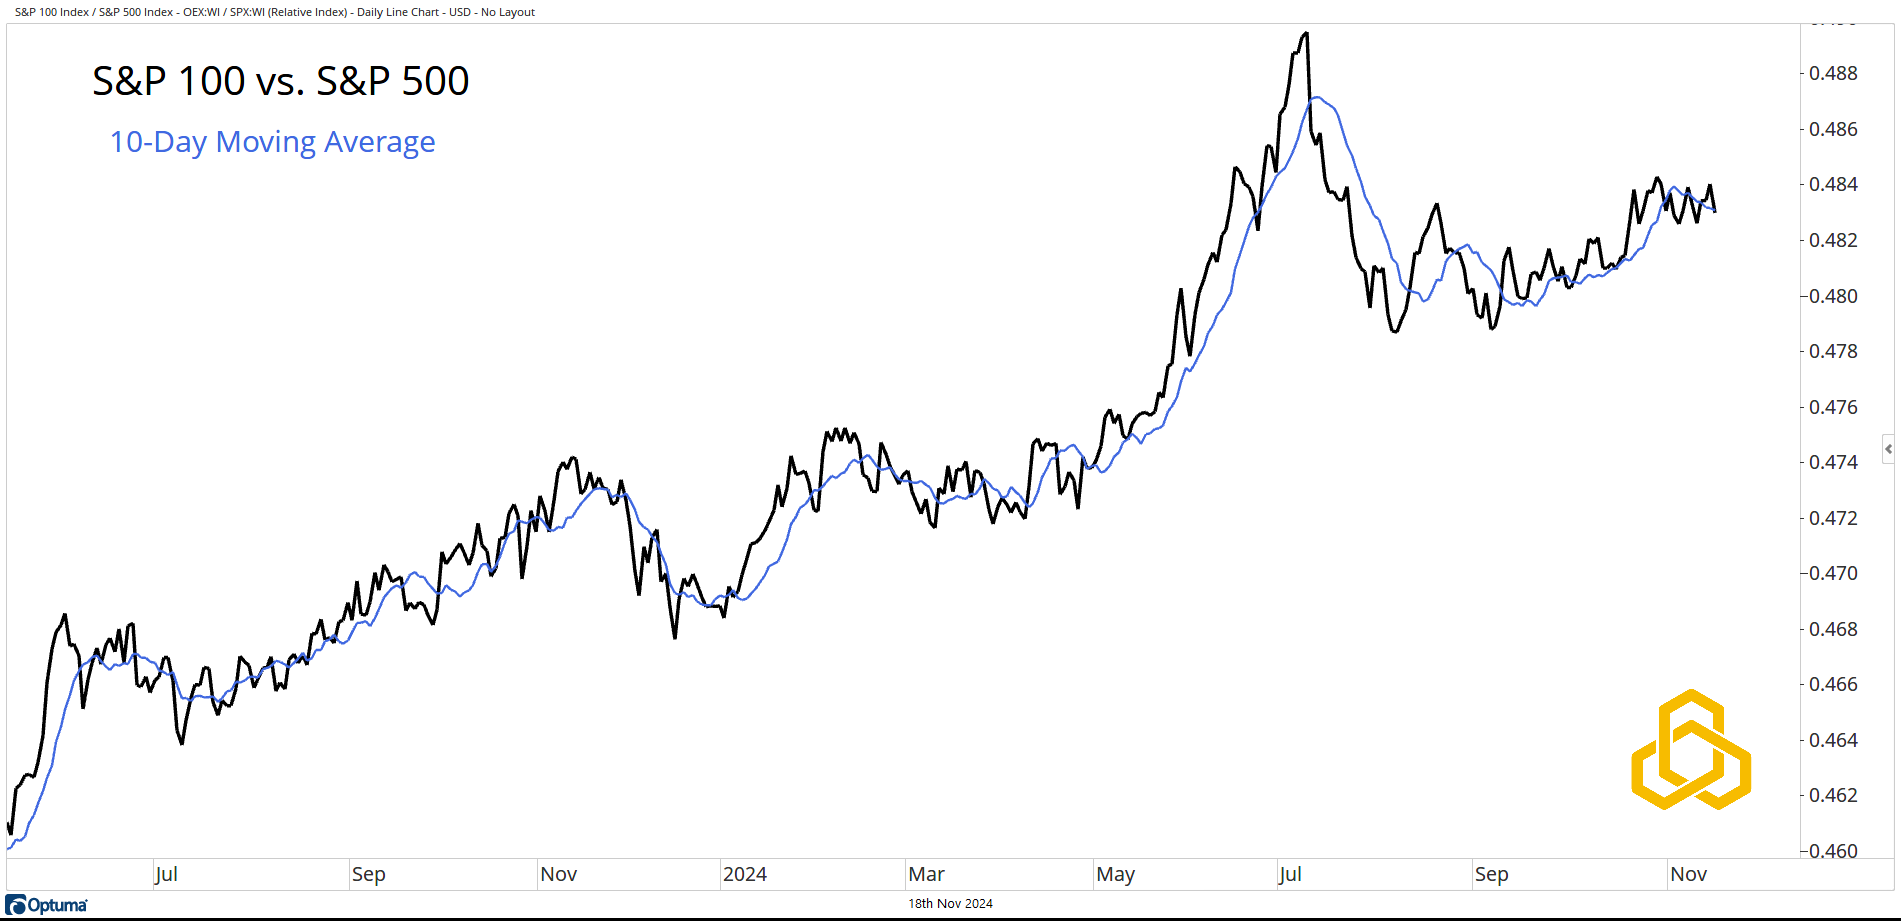
Source: Optuma
The preceding three charts point to the fact that investors have become slightly risk-averse in the short term. These ratios can reverse quickly. However, if this dynamic continues, there is greater risk that intermediate- and longer-term trends could begin to deteriorate. We are not there yet, but we are mindful.
Semiconductors vs. S&P 500
The ratio of the Semiconductor Index to the S&P 500 is not one that is part of our composite models, but it is one that we like to monitor. It has been under pressure since July and has made a new cycle low below the 50- and 200-day moving averages. This former leader appears to have been dethroned.
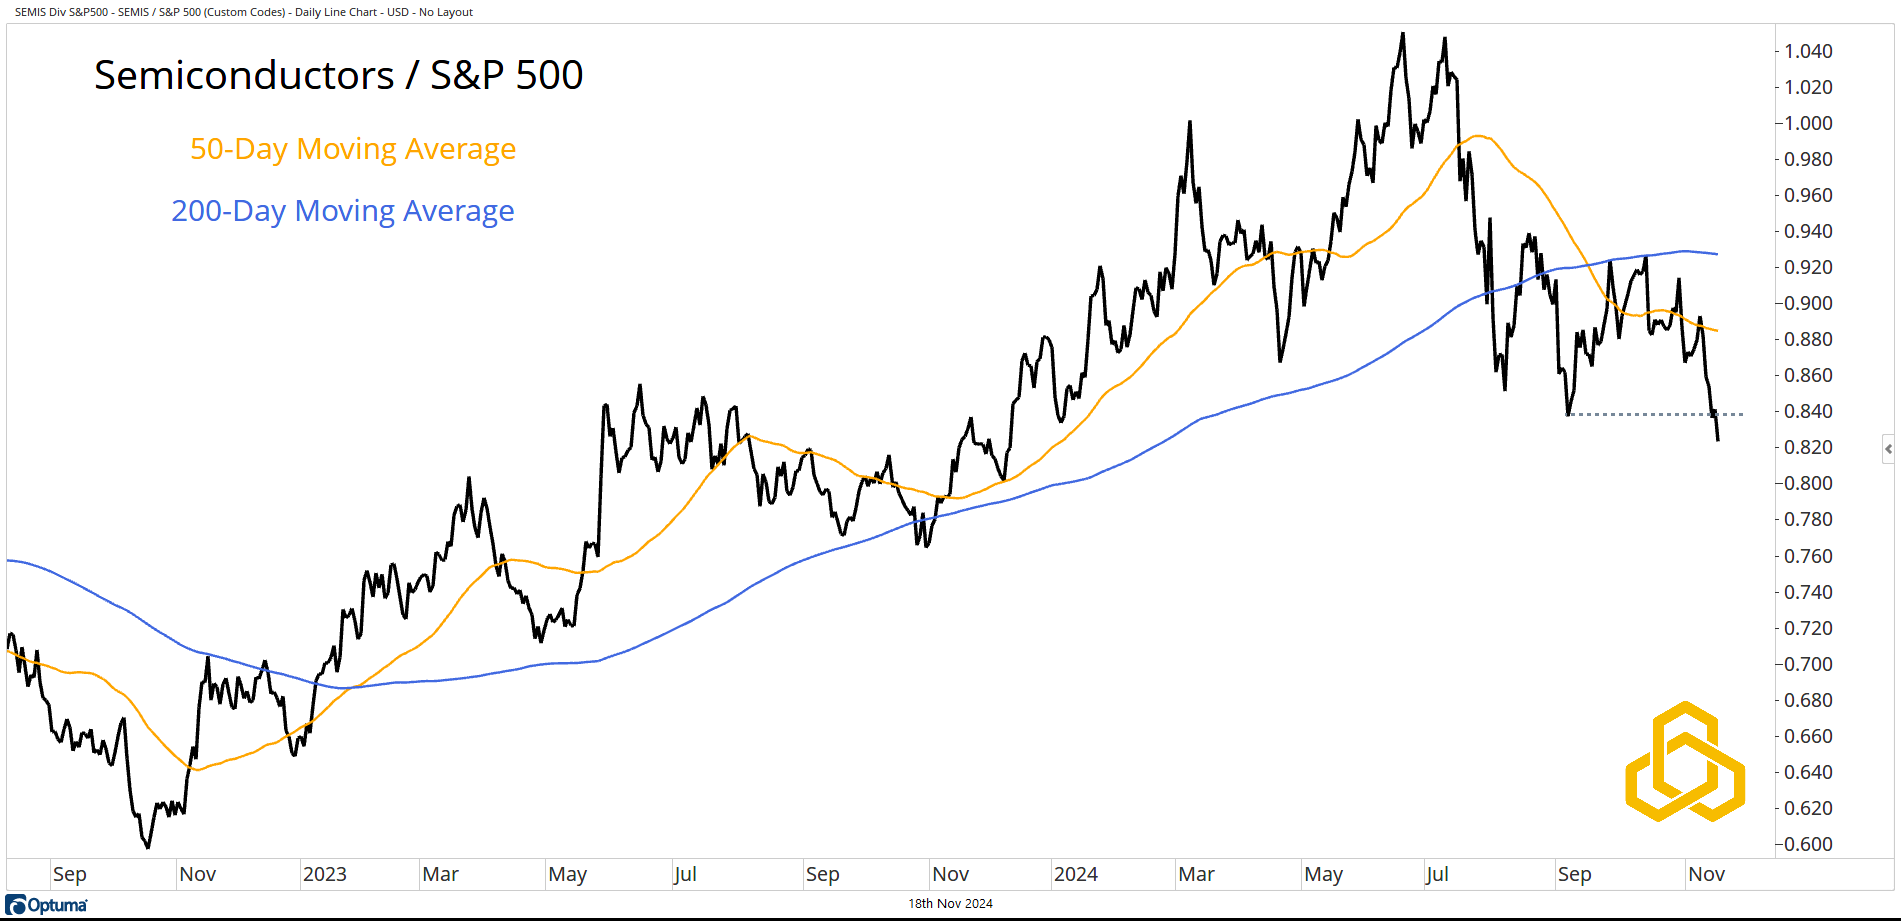
Source: Optuma
Disclosure: This information is prepared for general information only and should not be considered as individual investment advice nor as a solicitation to buy or offer to sell any securities. This material does not constitute any representation as to the suitability or appropriateness of any investment advisory program or security. Please visit our FULL DISCLOSURE page.
PFM-373-20241118