
.png?width=670&height=377&name=Sign_Email%20(1).png)
After making the cautious/bearish case for multiple weeks in these pages, last week we began to highlight what we would want to see for signs of a bottoming process. It’s important to note that we don’t make “calls” here. We assess the odds of market movements based on our rigorously tested systems.
Based on what we saw in the market last week, the odds of further intense weakness have diminished, and the odds of higher prices from here have begun to improve. However, bulls should note that the road is not lined with green lights just yet.
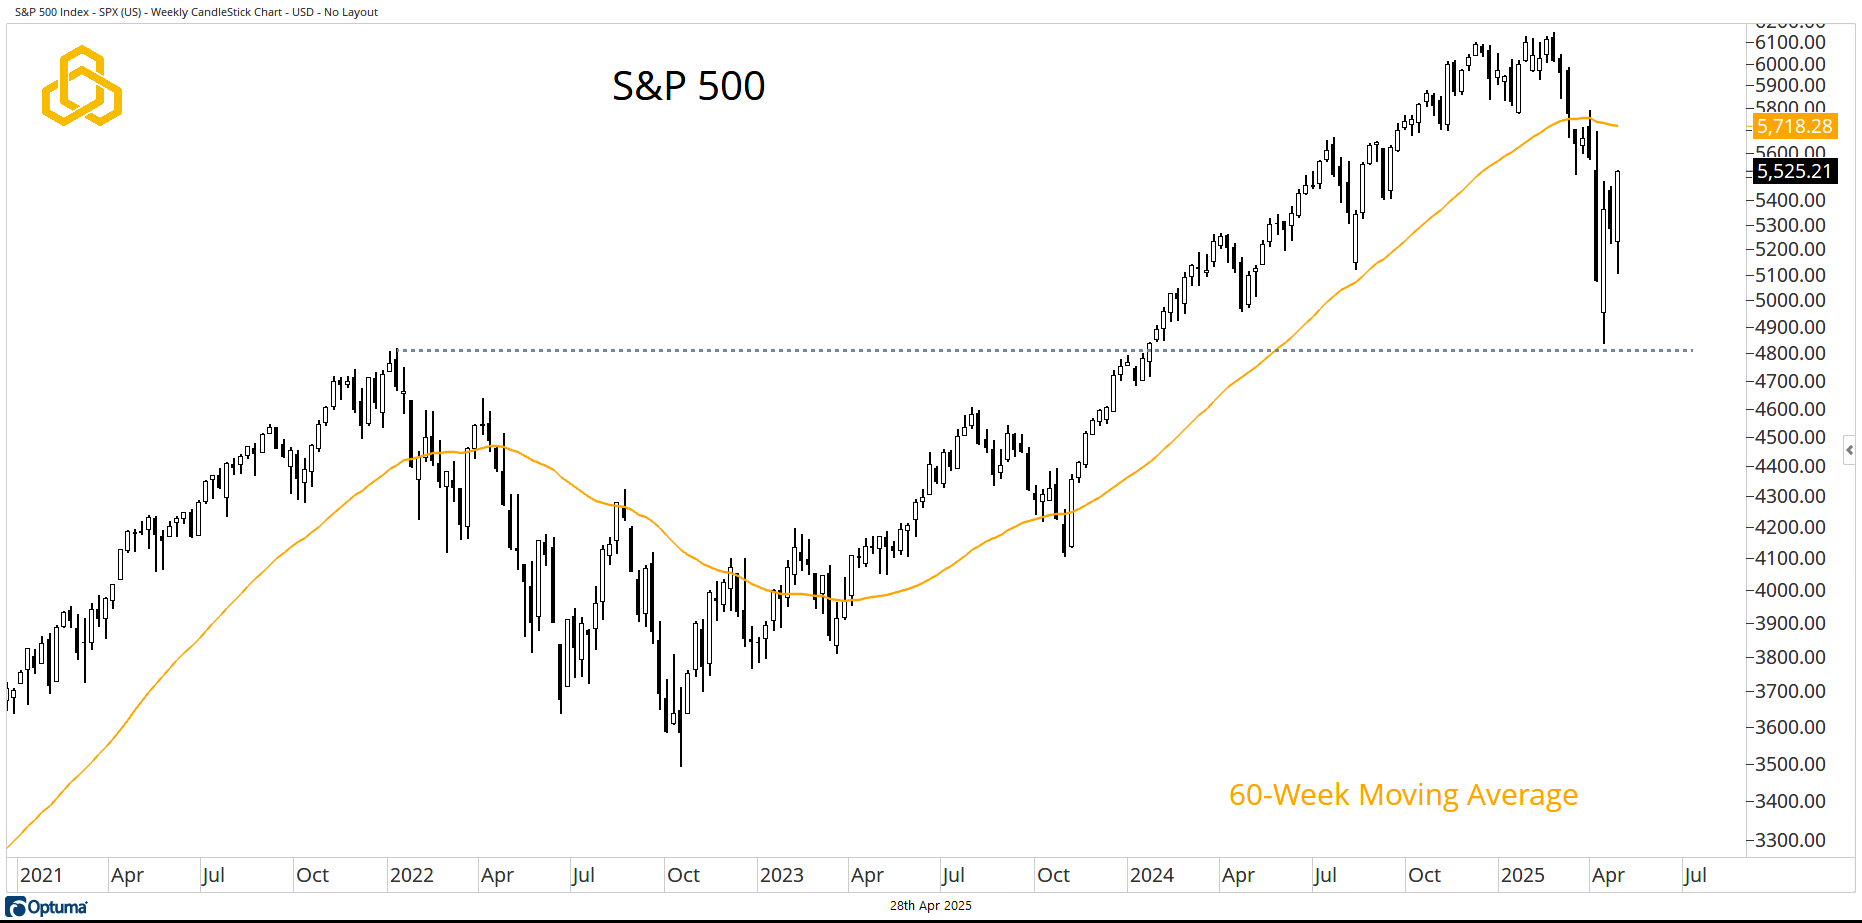
S&P 500
Let’s be clear: the S&P 500 remains in a bearish position below the 60-week moving average. Aggressive bulls can use the early 2022 highs as a frame of reference for risk management, while the more conservative types may find solace in waiting for the moving average to be reclaimed. The zone in between these levels is where a basing process is likely to playout.
Source: Optuma
Volatility
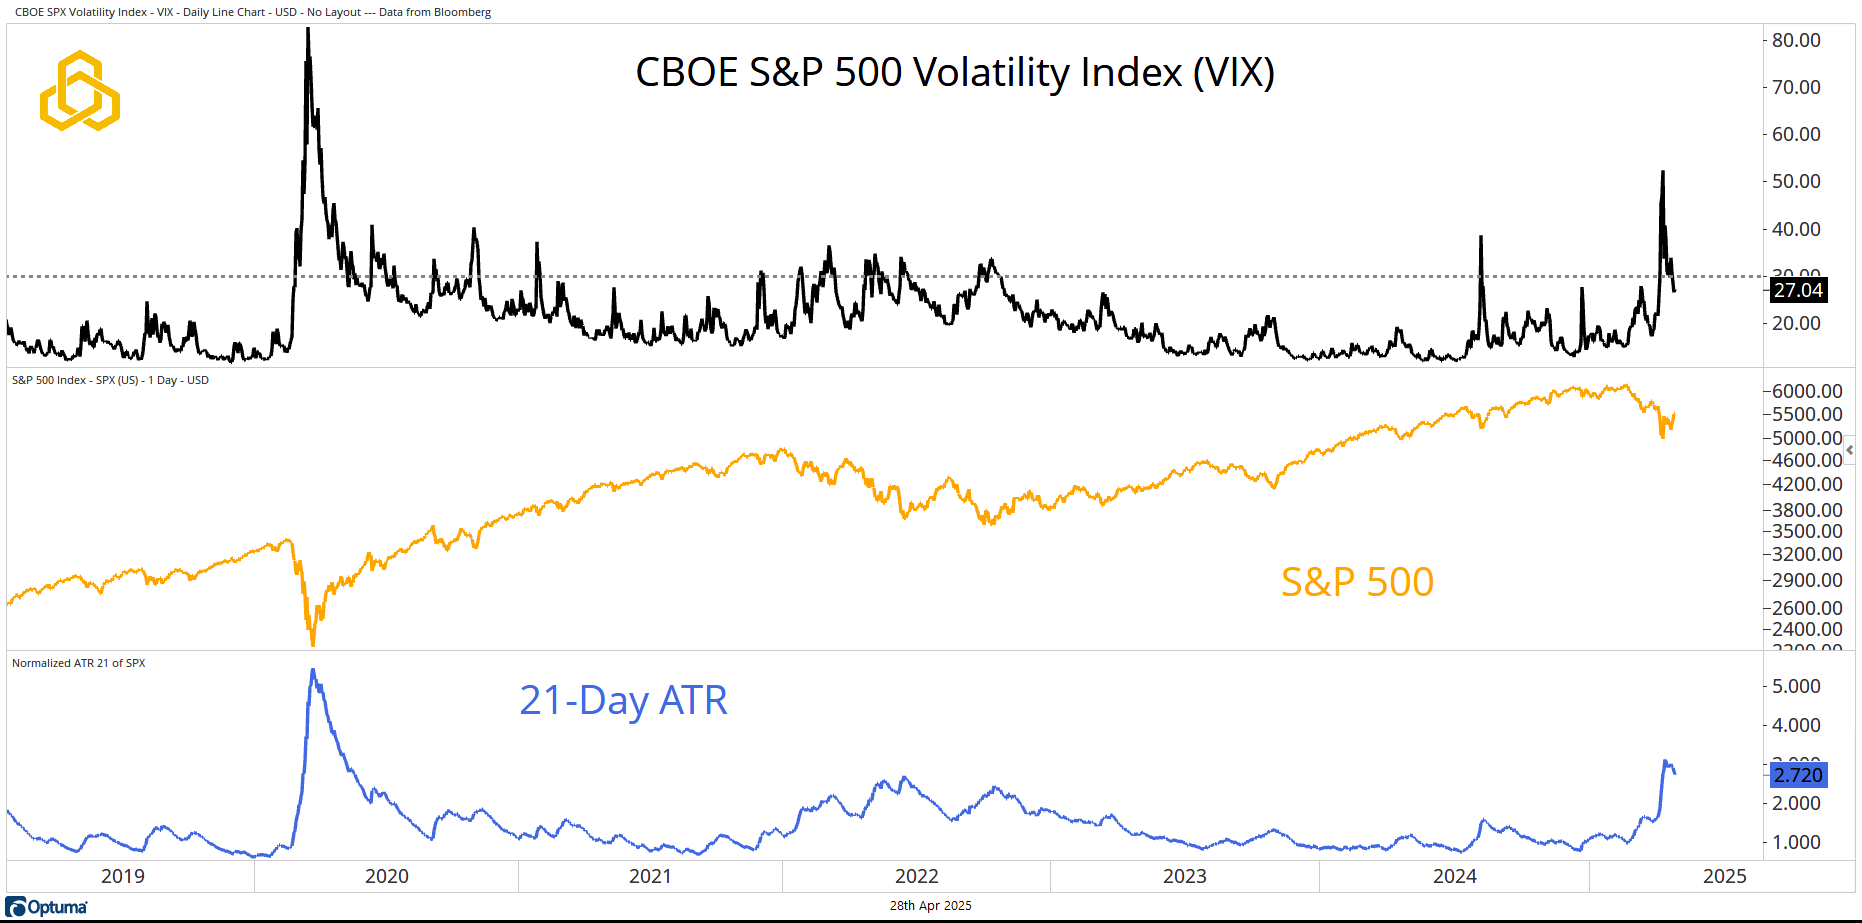
Last week, we noted that to have confidence in a recovery process, we want to see volatility abate. The S&P 500 had been realizing 3% moves per day based on the 21-day Average True Range (ATR)—that is not typical bull market behavior.
Last week, we saw the VIX move below 30, closing at 27.04, signaling that investors expect the S&P 500 to move approximately 1.69% per day over the next month. Meanwhile, the 21-day ATR has moved lower to 2.72%. The market is now pricing calmer waters for stocks than what recent history has delivered. That is a step in the right direction.
Source: Optuma
Breadth
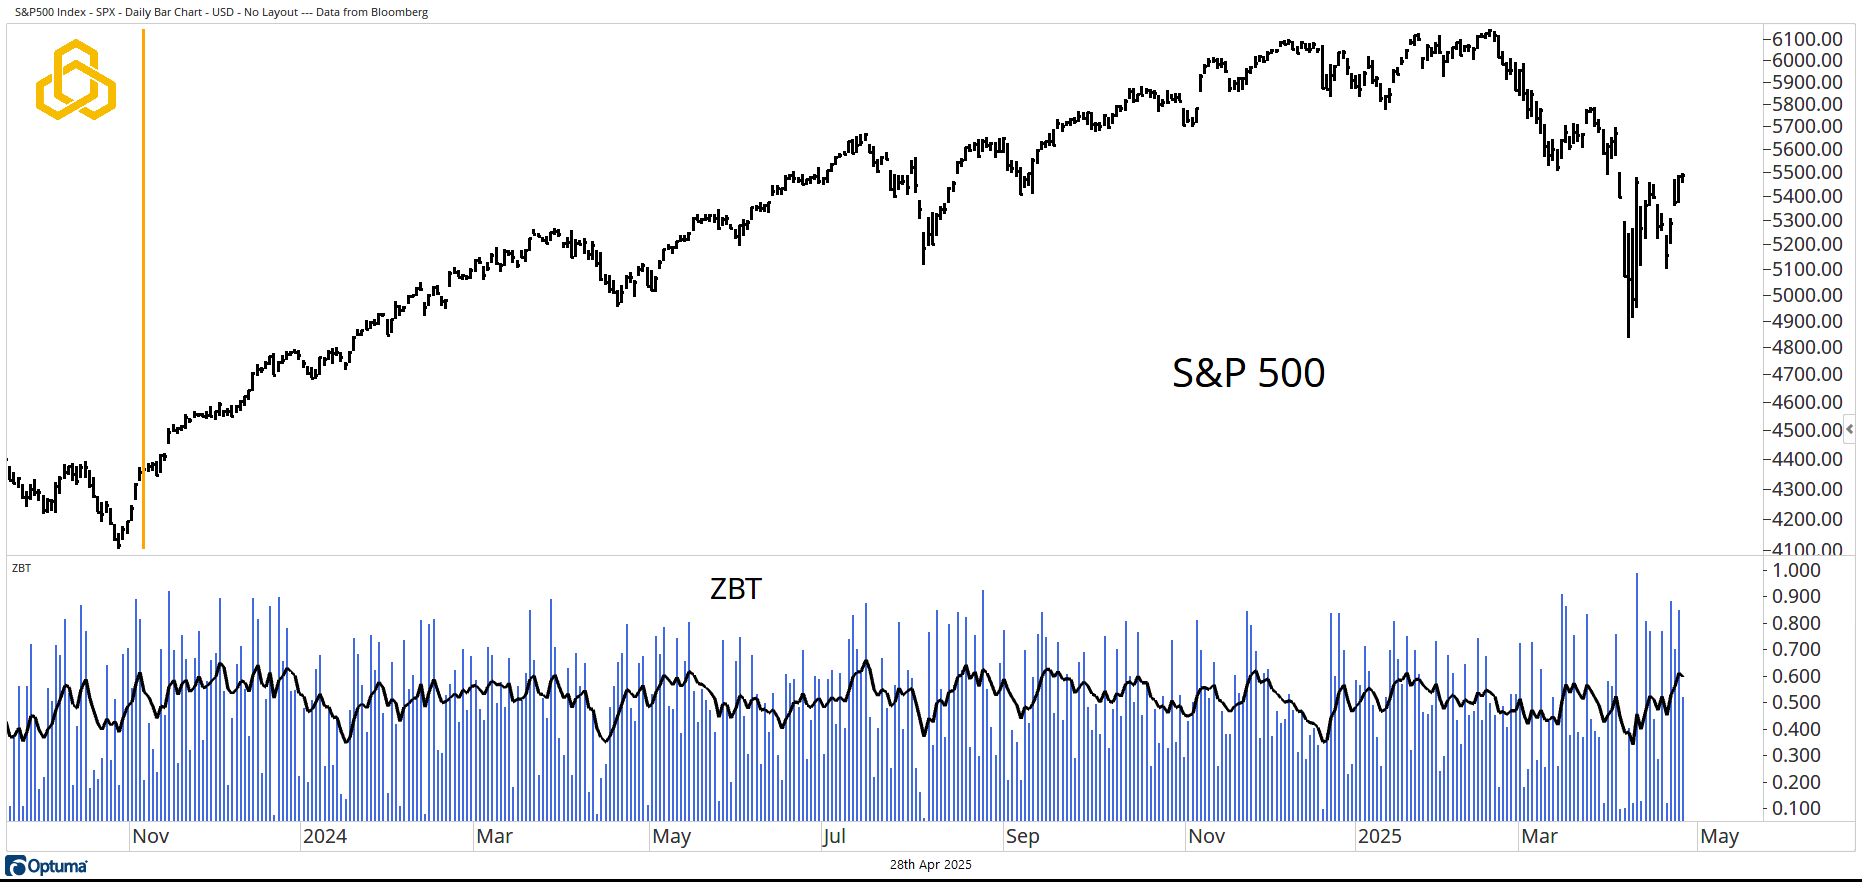
Unless you haven’t had access to a computer over the past few days, it would be hard to miss that the extremely rare Zweig Breadth Thrust (ZBT) fired last week.
The ZBT is calculated as a 10-day moving average of NYSE Advancing Issues / (Advancing Issues + Declining Issues). A buy signal occurs when the moving average moves from oversold to overbought within any ten-day period. To be precise: an oversold condition is a reading below 0.40, and an overbought condition is a reading above 0.615.
The moving average was below 0.40 on April 10th and crossed above 0.615 on Thursday, generating the ZBT signal. The gold vertical line on the chart highlights the last signal, which occurred in November 2023. The ZBT has had bullish intermediate-term implications in the past.
Source: Optuma
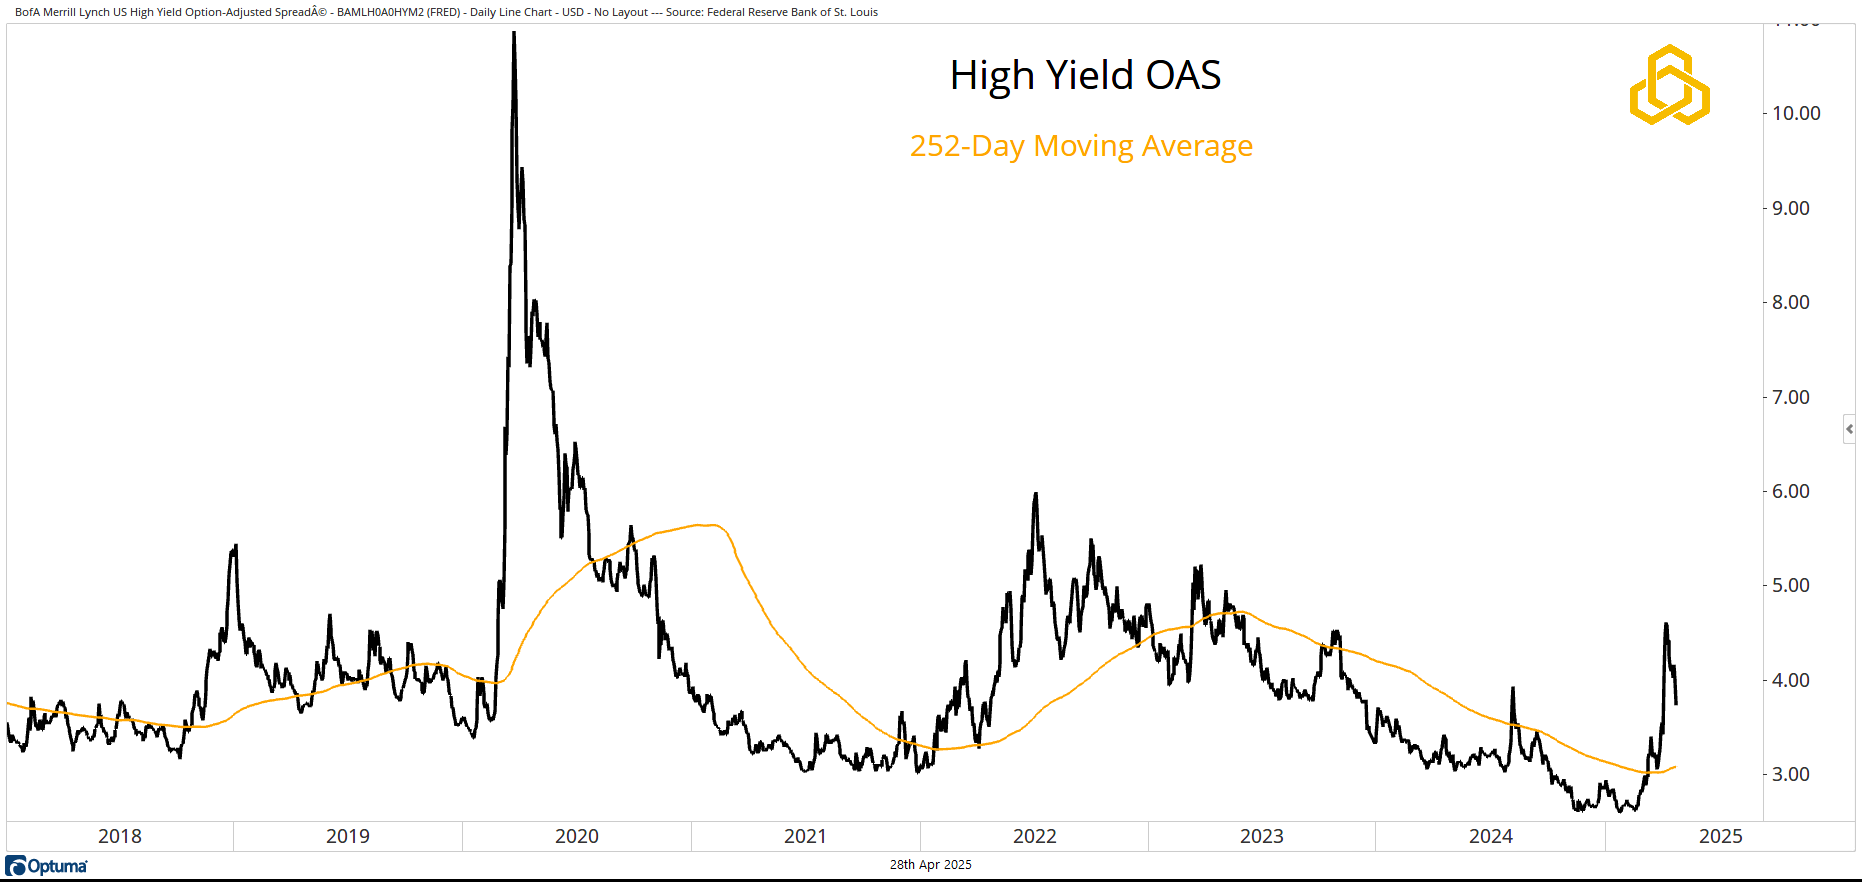
High Yield Credit
Finally, we are beginning to see improvements in high yield credit. The High Yield OAS (Option-Adjusted Spread) has moved lower over the past three weeks. Yes, it remains above the 252-day moving average (remember, not all lights are green yet), but the narrowing of spreads is a welcome sign for equity bulls. Improvements in the high yield market tend to correlate with stronger stock prices.
Source: Optuma
Disclosure: This information is prepared for general information only and should not be considered as individual investment advice nor as a solicitation to buy or offer to sell any securities. This material does not constitute any representation as to the suitability or appropriateness of any investment advisory program or security. Please visit our FULL DISCLOSURE page.
PFM-313-20250428