

For the second consecutive week, the major averages in the U.S. reversed losses to close near the top of the range. In the case of the S&P 500 and the NASDAQ 100, those rallies have brought the indices to their respective 60-week moving averages. This is a logical spot for the bulls and the bears to have a “little dance.”
If we look at the market through the Potomac lens, we’ll make the case that the trend is neutral at best, breadth is improving, and intermarket themes are bearish. Not exactly an uber-bullish regime, but also not one that makes me want to break out the “Doomsday Dan” theme.
S&P 500
The S&P 500 has rallied to the underside of the 60-week moving average, a key measure of the intermediate/long-term trend in our work. Bulls need to decisively push through this level to have confidence that the worst is over. Bears will need to defend this line and ultimately take out the 2022 peak to convince us that a larger decline is in order. Between these levels, the market is a choppy mess. It will be an interesting dance.
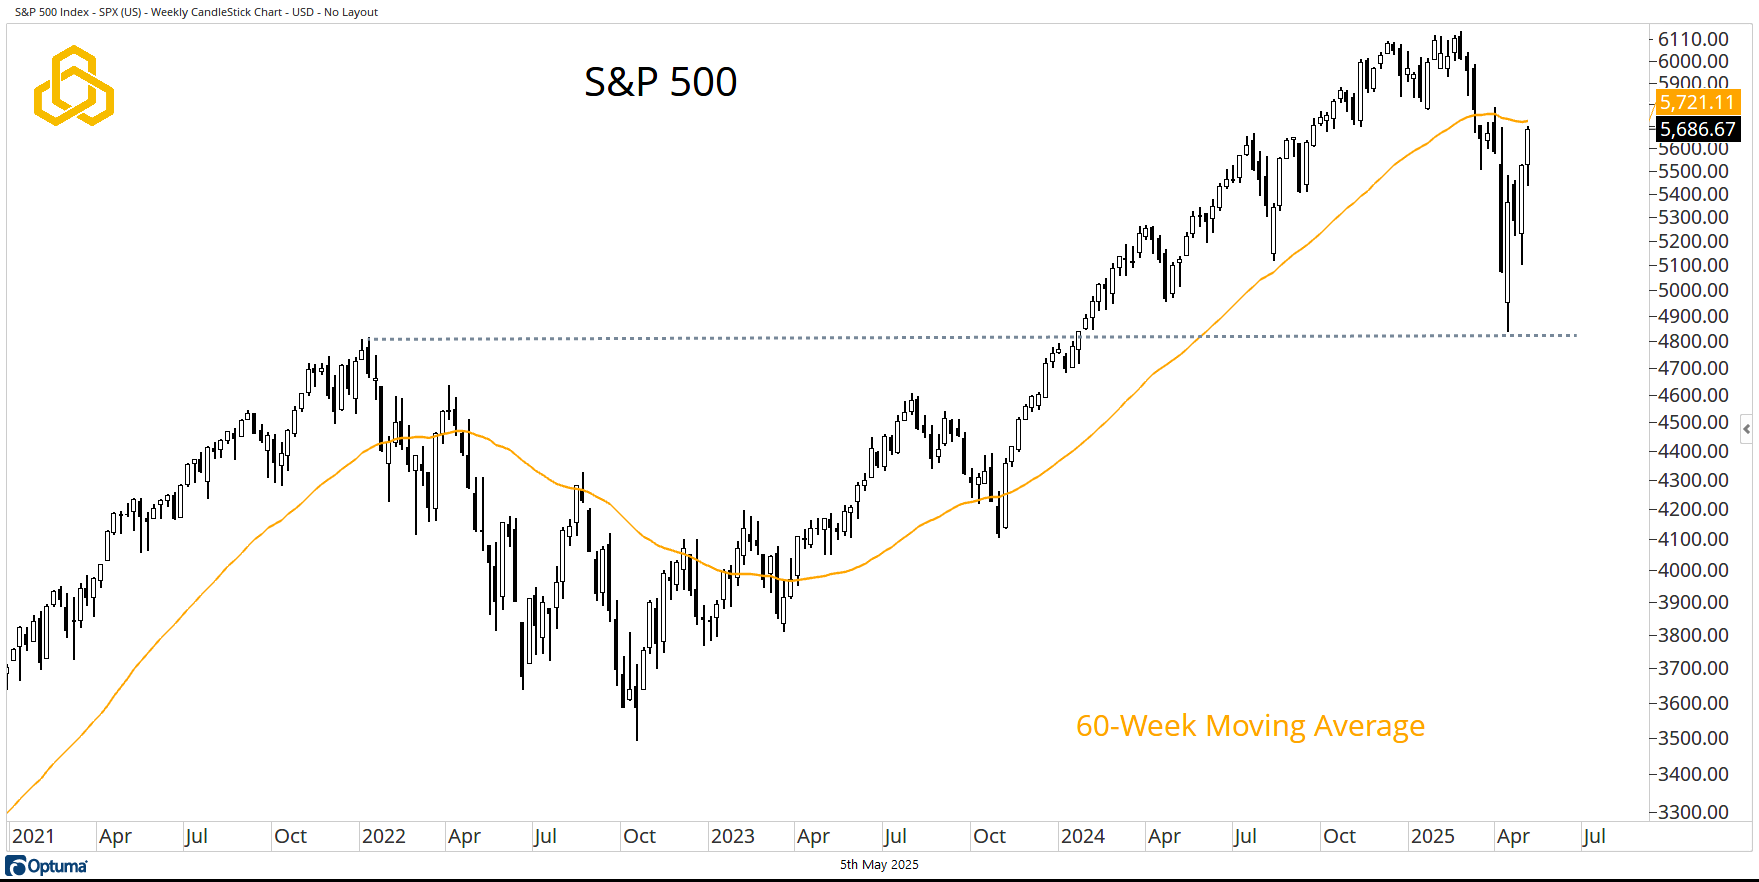
Source: Optuma
NASDAQ 100
Everything that we wrote about the S&P 500 applies to the NASDAQ 100. Bulls can increase their aggression above the 60-week moving average while shooting against the 2021 highs for risk management purposes. Bears are likely to view weakness near the moving average as a signal to reduce exposure and/or open shorts.
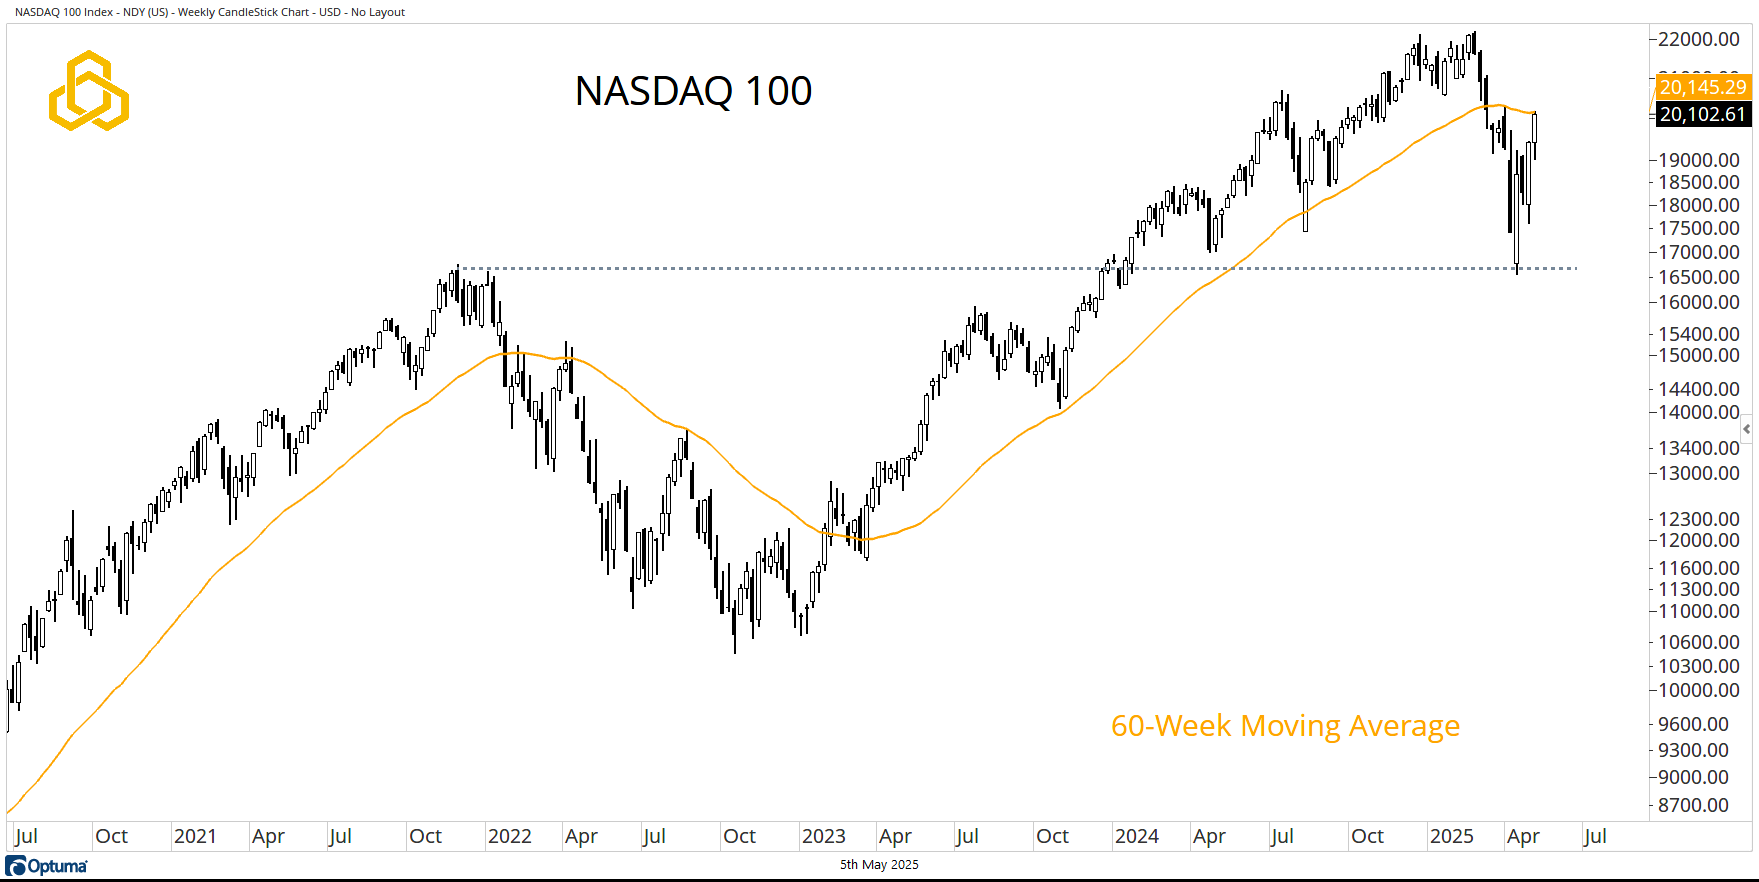
Source: Optuma
NYSE Advance/Decline Line
Breadth is improving—even the most perma of permabears would have to admit as much. The Advance/Decline Line on the NYSE has broken the downtrend from the November 2024 peak, while the one-year stochastic has given us an impressive rebound.
Perhaps even more impressive is the fact that the NYSE Advance/Decline Volume Line is on the verge of making a new high.
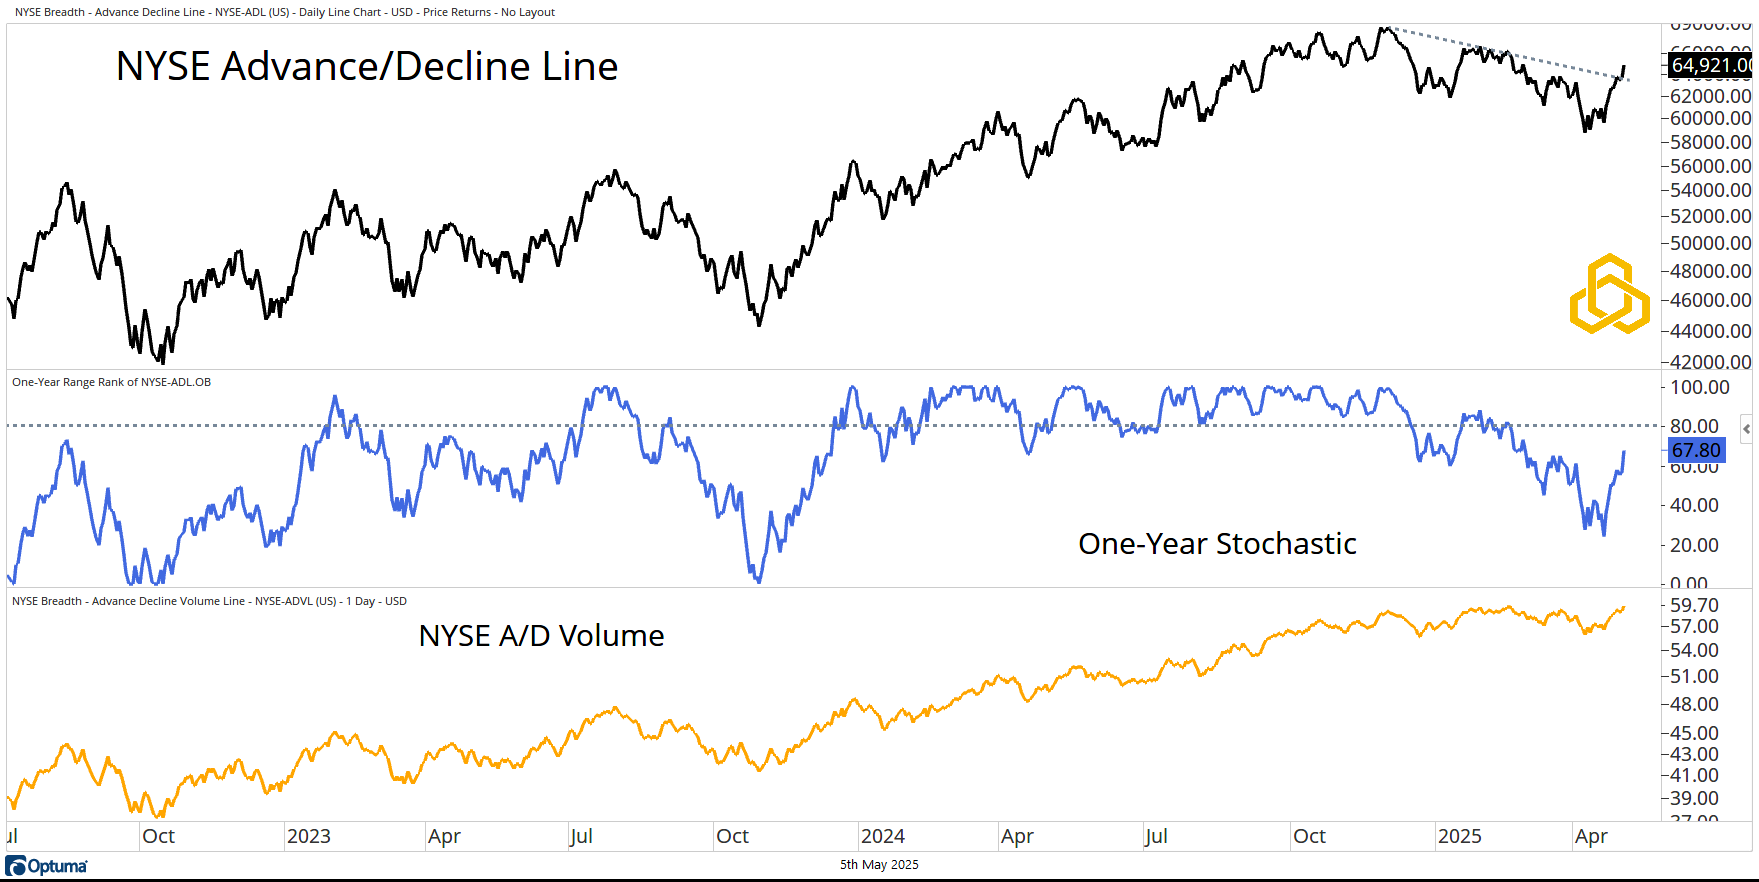
Source: Optuma
Dow Jones Transportation Average
The Dow Jones Transportation Average has been, and remains, the weakest link in our intermarket based work. Despite a rebound last week, it is still well below the declining 27-week moving average. While it is not an absolute necessity for this index to “get in gear,” it would be an added datapoint for the bulls if it did.
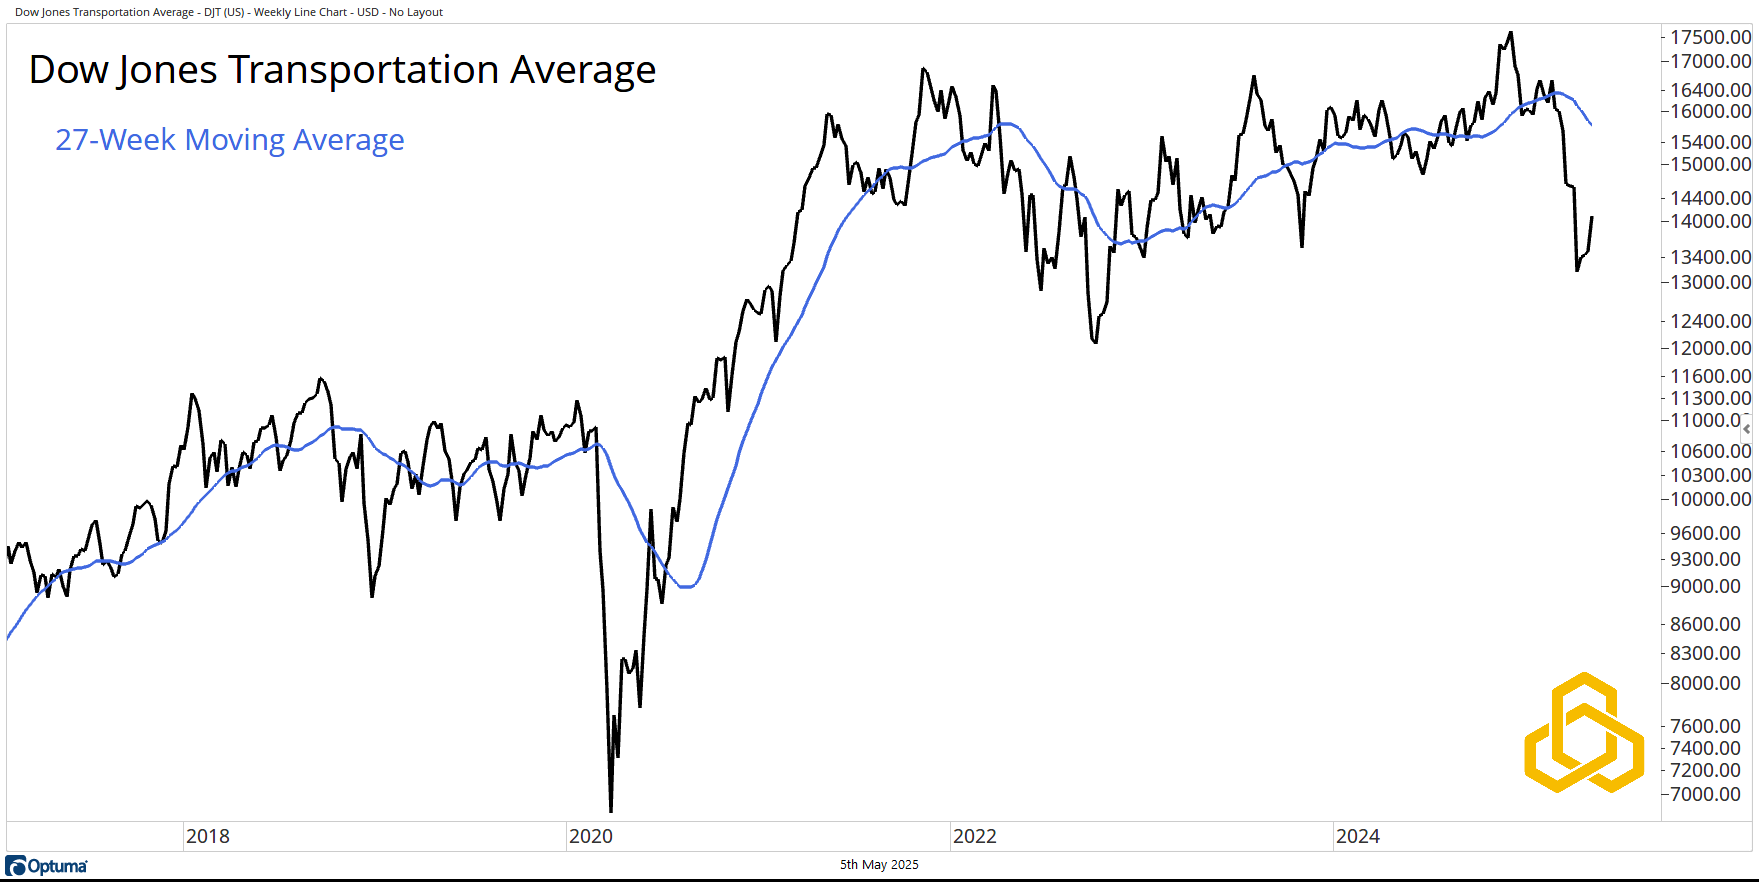
Source: Optuma
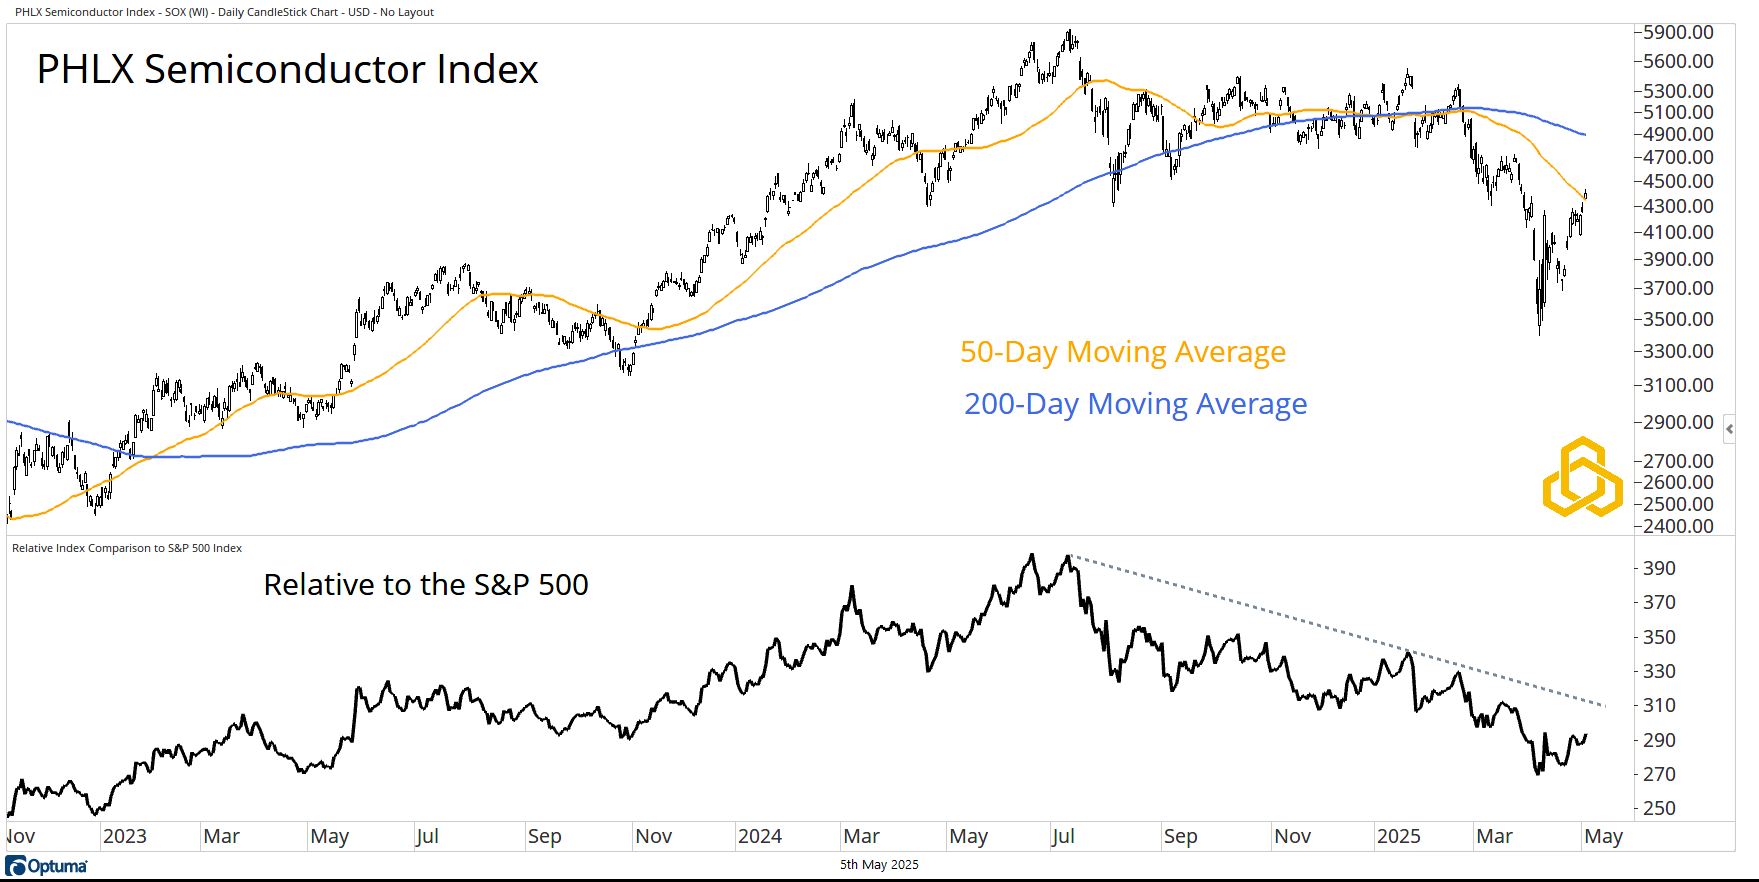
Semiconductors
Readers who know me—based on my writing and other commentary—know that I believe the semiconductor is arguably one of the five most important innovations of all time. While they are not explicitly part of our models, we do pay close attention to the trend here. The PHLX Semiconductor Index is dancing with the declining 50-day moving average, below a declining 200-day moving average. Admittedly, not a great look.
At the same time, the trend relative to the S&P 500 is bearish.
Source: Optuma
Disclosure: This information is prepared for general information only and should not be considered as individual investment advice nor as a solicitation to buy or offer to sell any securities. This material does not constitute any representation as to the suitability or appropriateness of any investment advisory program or security. Please visit our FULL DISCLOSURE page.
PFM-314-20250505