
The most common method to calculate a strategy’s performance is the calendar-year return. This method strictly views performance from January 1, through December 31. By doing so, anchoring to outlier years such as 2001 or 2008 is common. The most memorable calendar years stick with people.
This line of thinking also produces questions such as:
“How much are you up this year?”
“How was performance last year?"
While it is simple to sort data this way, there are flaws.
In life, most things are not restricted to a calendar-year, and return analysis should not be either.
Drawback of Calendar-Based Returns
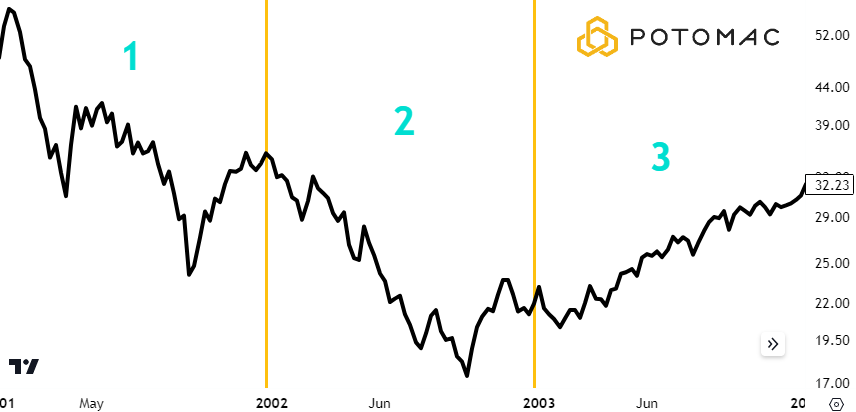
To illustrate this flaw, view the chart below of the Invesco QQQ ETF (Nasdaq 100) from the start of 2001 to the end of 2003.
Section one is calendar year 2001
Section two is calendar year 2002
Section three is calendar year 2003
Return for each period:
2001: -33.56%
2002: -38.41%
2003: +47.55%
At the end of 2002, the Nasdaq 100 was down -59.08%. Math says that it would require 144.38% to get back to even.
However, if an advisor reviewed their allocations on the last day of 2003 based on the calendar, they would have seen a positive yearly return of +47.55% for the ETF.
Isolating the calendar year 2003, overlooks the fact that the investment would still be in a drawdown of -39.62%.
Because of the math behind compounding, the path of investment returns is a key factor. As seen in this example, calendar-based returns can mask this issue.
This may become problematic when investing in a tactical strategy. The tactical strategy will likely be judged poorly if it underperformed in 2003 when the Nasdaq 100 was up 47.55%. That judgement often excludes the context of poor Nasdaq 100 performance in 2002 and reflects a short-term view.
Knowing that the Nasdaq 100 was recovering out of a bear market puts things into perspective. The goal of a tactical strategy is to not have the -59% drawdown to overcome. If the drawdown is significantly less during the bear market, massive gains on the way out aren’t needed to make new equity highs.
Rolling returns attempt to solve the problem of standard yearly returns by shifting the period each time new data is collected. This allows a more fluid measure of performance that isn’t tied to the calendar year.
Rolling Return Calculation
Although imperfect, rolling returns are ultimately the better solution.
Morningstar states that “Rolling period returns can provide a fuller view of a fund's performance than you can get by looking at a single-period trailing return.” (Morningstar)
As stated, the intended goal of rolling returns is to see how an investment has performed over varying periods. Not based solely on the calendar year.
If the 12-month rolling return, based on monthly data, this past quarter end 03/31/2024, was 10%, that means that from exactly one year ago, the investment made 10%.
To calculate the next rolling 12-month return, the starting and endpoint are shifted forward one month. That would make the calculation between April 30, 2023, and April 30, 2024.
One month is dropped off from the data and one month is added. This is the same concept used in calculating moving averages for a stock or index.
This process is repeated each month and results in a new rolling return number each time.
Drop-off Effect
The main flaw of rolling returns is a byproduct of the calculation. When data is calculated by using a specified time frame that shifts, old data must be dropped off as new data is added. The technical term for this is the “drop off effect”.
Coming out of bear markets, stocks tend to rebound with high velocity. If the oldest data in a rolling return calculation was during a severe bear market, as it begins to drop off, the new data is picked up and the rolling return goes from deeply negative, to positive quickly.
Viewing the rolling return number without this context can be misleading.
The chart below shows the S&P 500, and its rolling 12-month returns from 2003 through the end of Q1 2024.
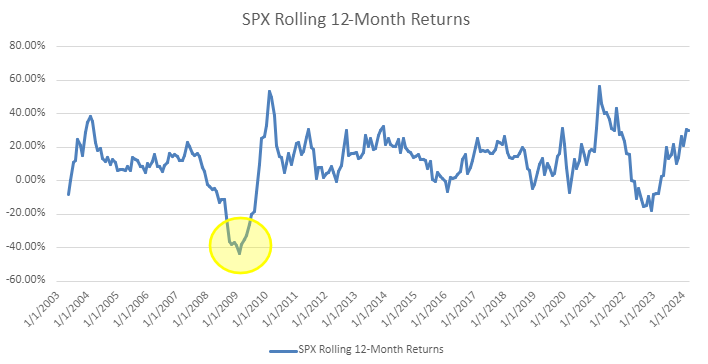
The highlighted data point shows that on 2/28/2009 the rolling return was -43.32%. Recall that this number reflects the performance of exactly a year prior, which was during the great financial crisis.
As time passes, the bear market performance drops off and the bull market numbers are added.
That is why the swing in rolling return goes from -43.32% to 53.62% in just over a year.
The bad has been dropped off, and the good added.
An investor reviewing their statement may be pleased with a 53.62% gain over the past year. The key part missing from that data is that the S&P 500 had a drawdown of over -47% before realizing those gains.
Correlation & Rolling Returns
Because of the drop off effect, rolling returns over the short-term can be misleading. If full market cycles are included, they provide a more complete view when comparing investment options.
That is especially true for strategies that are not highly correlated to a benchmark. For a moderately correlated tactical strategy, rolling returns can provide a good comparison over full market cycles.
The pitfall of nearsightedness is choosing a rolling period that only includes a certain type of market. In doing so, rolling returns may become skewed as the drop-off effect takes place.
Bull Bear vs. S&P 500
The chart below shows the monthly difference between the 12-month rolling returns comparing the S&P 500 Total Return and the Bull Bear strategy. When the blue line is negative, Bull Bear has outperformed the S&P 500 by the amount reflected on the Y-Axis over the prior 12 months.
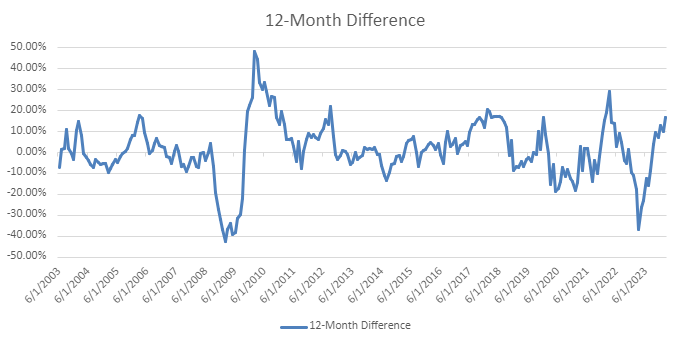
To better explain, let’s zoom in on 6/1/2009. As the market was coming out of the great financial crisis, Bull Bear outperformed the S&P 500 by more than 40% over the 12 months prior.
Again, the datapoint reflects performance over the most recent twelve months. It is a backward-looking measure.
Tactical strategies may have swings in relative performance as stocks recover from bear markets. This can be the result of a delay in fully re-entering stocks rather than attempting to call the exact bottom.
The chart below is the same, with highlights added.
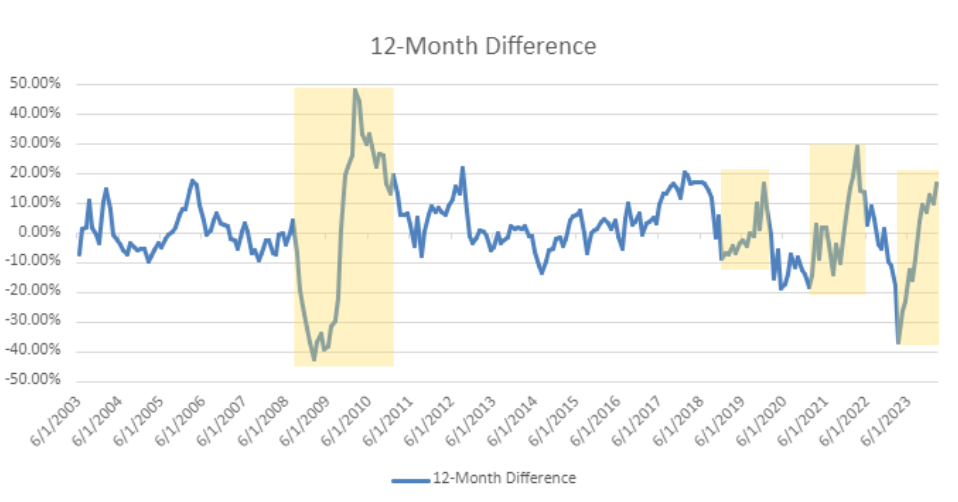
The four highlighted periods all start with outperformance for Bull Bear, and end with the S&P 500 outperforming. We would expect our rolling 12-month returns to look compelling relative to the S&P 500 after a bear market as these numbers reflect performance that has happened in the past.
Coming out of a bear market, the prior months begin to drop off, and new numbers are posted. This reduces the impact the bear market has on the measure as time goes on.
No tactical strategy can be expected to have it both ways all the time. Protecting losses during stock drawdowns and then calling the exact bottom to still outperform on the way up.
In the past, periods of Bull Bear outperformance have preceded times when the S&P 500 has rallied sharply relative to Bull Bear, and that is okay.
Famed behavioral economist Daniel Kahneman said in his book, Thinking, Fast and Slow, that “We are driven more strongly to avoid losses than to achieve gains.” That does not mean that missing potential gains is easy; it only means losing hurts more.
If the investor did not experience the pain of heavy losses in a bear market, it is easier to focus on the feeling of missing out when stocks outperform coming out of it.
If Bull Bear did not have a drawdown painful enough for the investor to feel the negative emotion, that would be ideal. The problem is that the investor does not know what they did not experience.
On our side of the table, this is a good thing, especially in the context of not participating in large drawdowns. However, it goes against us when stocks rip higher afterward, and our rolling return numbers are lower than that benchmark.
Considering the path of investment returns is crucial. Especially when viewing rolling returns.
Zoom Out
In investing, one of the most difficult things to do is remember to look at the long-term picture. Not in the sense of a buy-and-hold, “it always comes back mentality,” but from an underperformance standpoint.
Zooming out allows a more holistic view of where we are and where we have been.
The chart below shows the spread in performance between Bull Bear and the S&P 500 for two time periods.
The rolling 12-month difference is the blue line below.
The orange represents a three-year rolling return spread between Bull Bear and the S&P 500.
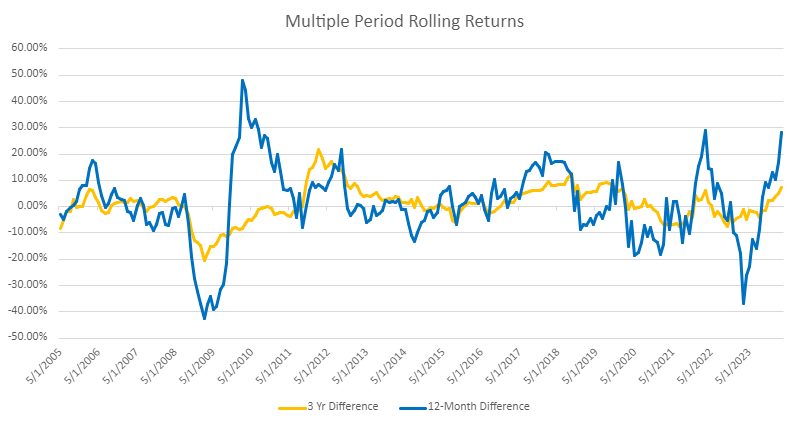
What we would expect is for the longer-term measure to be a smoother comparison and to have less dramatic swings in relative underperformance and outperformance.
That is the case with these two measures. As of 3/31/2024, the standard deviation for the 12-month difference was 14.03% while the 3-year was 6.47%. In other words, the blue line has had nearly twice the fluctuation as the orange line.
Zooming out and using a three-year rolling return measure to compare Bull Bear with the S&P 500 shows less significant swings in underperformance and outperformance.
Final Point
While short-term performance is misleading, calendar-year returns can cause the fear of missing out. Rolling returns provide a better solution, but keep in mind they must be coupled with a long-term view and awareness of the drop-off effect.
Including multiple market cycles in the analysis ultimately allows investors the opportunity to refocus on their plan while limiting the comparison to a benchmark.
In the case of Bull Bear, zooming out with the 3-year rolling return gives a less volatile view of performance. Long-term analysis in this way allows less emotional decisions for allocators that may feel the fear of missing out in the short-term.
*All charts are from Excel and Portfoliovisualizer.com. S&P 500 Total Return data is from YCharts.com. Past performance is not a guarantee of future results.
Disclosure: Potomac Fund Management (“Company”) is an SEC-registered investment adviser. This information is prepared for general information only and should not be considered as individual investment advice nor as a solicitation to buy or offer to sell any securities. This material does not constitute any representation as to the suitability or appropriateness of any investment advisory program or security. Please visit potomacfund.com/disclosures. The company does not make any representations or warranties as to the accuracy, timeliness, suitability, completeness, or relevance of any information prepared by any unaffiliated third party, whether linked to the Company website or incorporated herein, and takes no responsibility for any of this information. The views of the Company are subject to change and the Company is under no obligation to notify you of any changes. Different types of investments involve varying degrees of risk, and there can be no assurance that the future performance of any specific investment or investment strategy will be profitable or equal to any historical performance level.
Performance results reflect the composite performance of all fully discretionary portfolios managed by Potomac according to the strategy subject to policies that may require the exclusion of certain accounts. All returns are time-weighted and reflect the reinvestment of dividends and capital gain distributions. Net performance reflects the deduction of a model fee (the highest investment advisory fee charged by Potomac), underlying fund management fees, other fund (administrative) expenses and, if any, redemption or 12b1 (fund marketing) fees. Net of fee returns are calculated using a model fee of 2.5%. The model fee, applied monthly, is the highest fee that may be or has been charged to an investor in this composite. Actual investment advisory fees incurred may vary. Past performance does not guarantee future results. There is no guarantee that any investment strategy or account will be profitable or will avoid loss. Individual investors’ objectives, financial situations, their specific instructions, or restrictions on investments, or the time at which an account is opened, or additions are made may result in different trades and returns. Performance for the strategy presented may differ materially (more or less) from the performance of the comparable benchmark and other Potomac investment strategies. Market and economic conditions could change in the future producing materially different returns. Results do not reflect the impact of taxes for taxable accounts or their owners. You cannot invest directly in an index. This presentation is supplemental to the composite report. The Annual GIPS® Report is available upon request. GIPS® is a registered trademark of CFA Institute. CFA Institute does not endorse or promote this organization, nor does it warrant the accuracy or quality of the content contained herein.
Important Definitions Used in this Report
S&P 500 Index TR: The S&P 500 TR index is a basket of 500 stocks that are considered to be widely held. The S&P 500 Index TR is weighted by market value, and its performance is thought to be representative of the stock market as a whole. The S&P 500 Index TR is one of the most commonly used benchmarks for the overall U.S. stock market. S&P 500 TR is a total return index adjusted for distributions (i.e., assuming that all distributions are reinvested).
Drawdown: A Drawdown is any losing period during an investment record. It is defined as the percent retrenchment from an equity peak to an equity valley. A Drawdown is in effect from the time an equity retrenchment begins until a new equity high is reached. The monthly maximum drawdown is used to calculate strategy scores, benchmark scores, and to determine the relevant benchmark.
Correlation: Correlation is a statistical measure that determines how assets move relative to one another.
PFM-322-20240430