

The only constant in markets is change.
Sometimes the change is short-term in nature, sometimes it takes years to play out. Whatever the case, market regimes change. It is during these changes that the largest risks and opportunities are available.
Last week saw the S&P 500 and the NASDAQ Composite Index log 6-day losing streaks for the first time since October 2022, a short-term change in market character. At the same time, stock/bond correlation continues to move further into positive territory on the one-year and five-year timeframes.
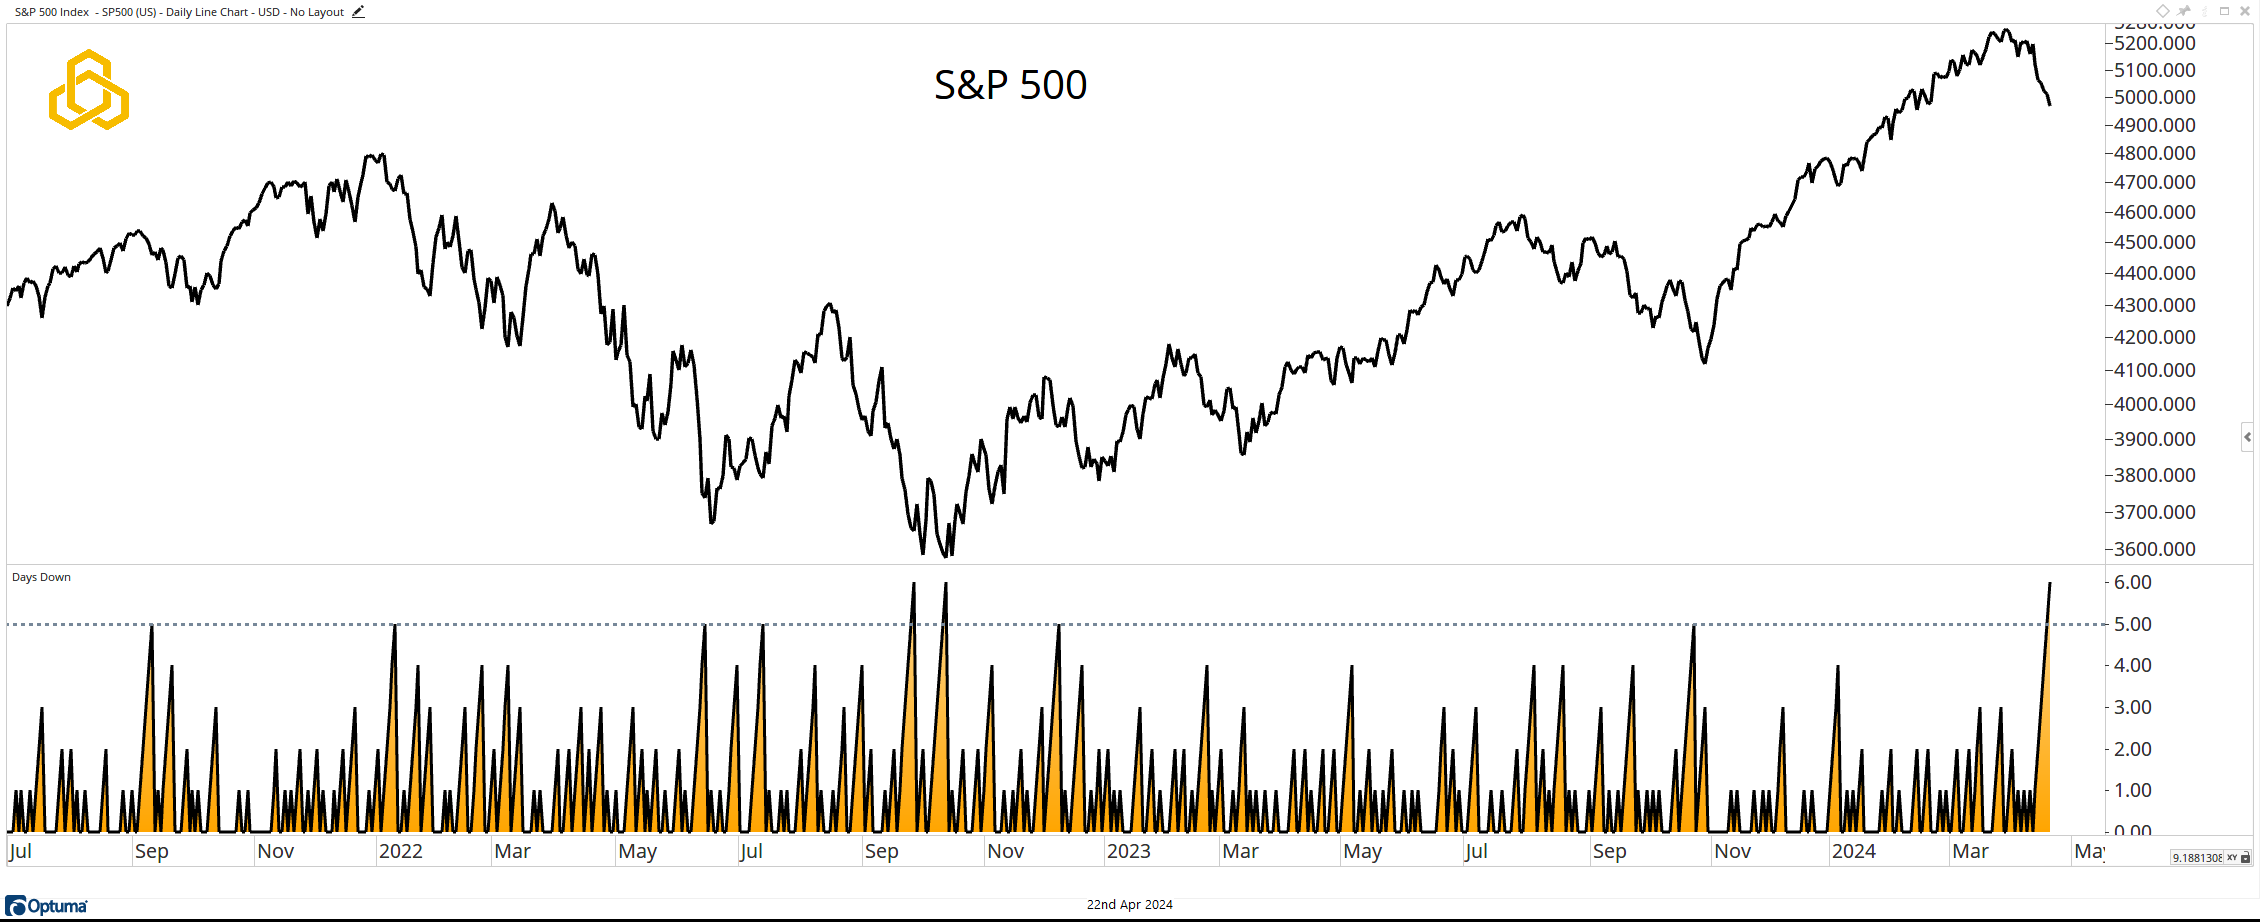
S&P 500
The S&P 500 closed lower for a sixth consecutive day (bottom panel) on Friday, something that it has not done since the beginning of the cyclical bull marker that began in October 2022. The case can certainly be made that a short-term oversold rally is possible, but a cluster of five to six down days in a row would be indicative of a shift in market character.
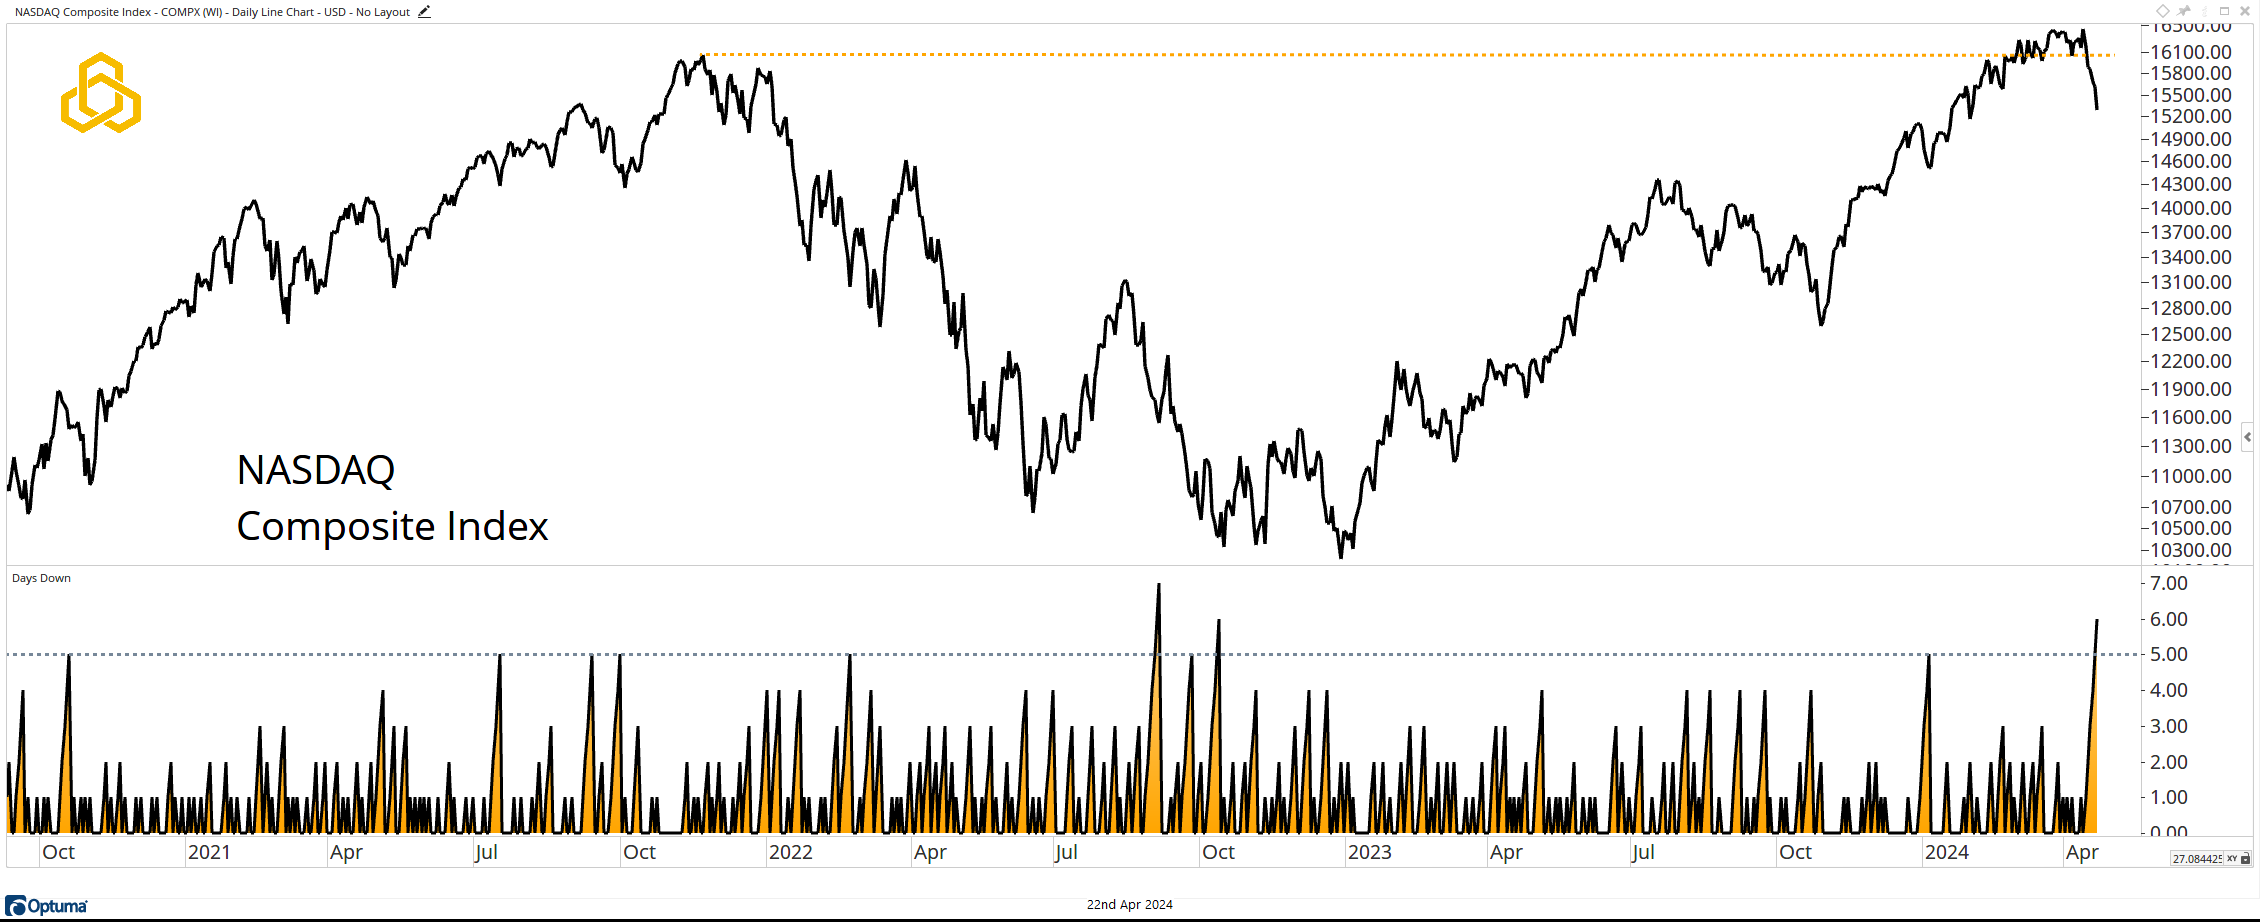
NASDAQ Composite Index
Not one to be outdone by the more high-profile S&P 500 Index, the NASDAQ Composite Index has also registered six losers in a row for the first time in 18 months. More ominous is the fact that the move comes on the heels of setting a record high above the 2021 peaks. Until the highs are regained, the benefit of the doubt sits with the bears.
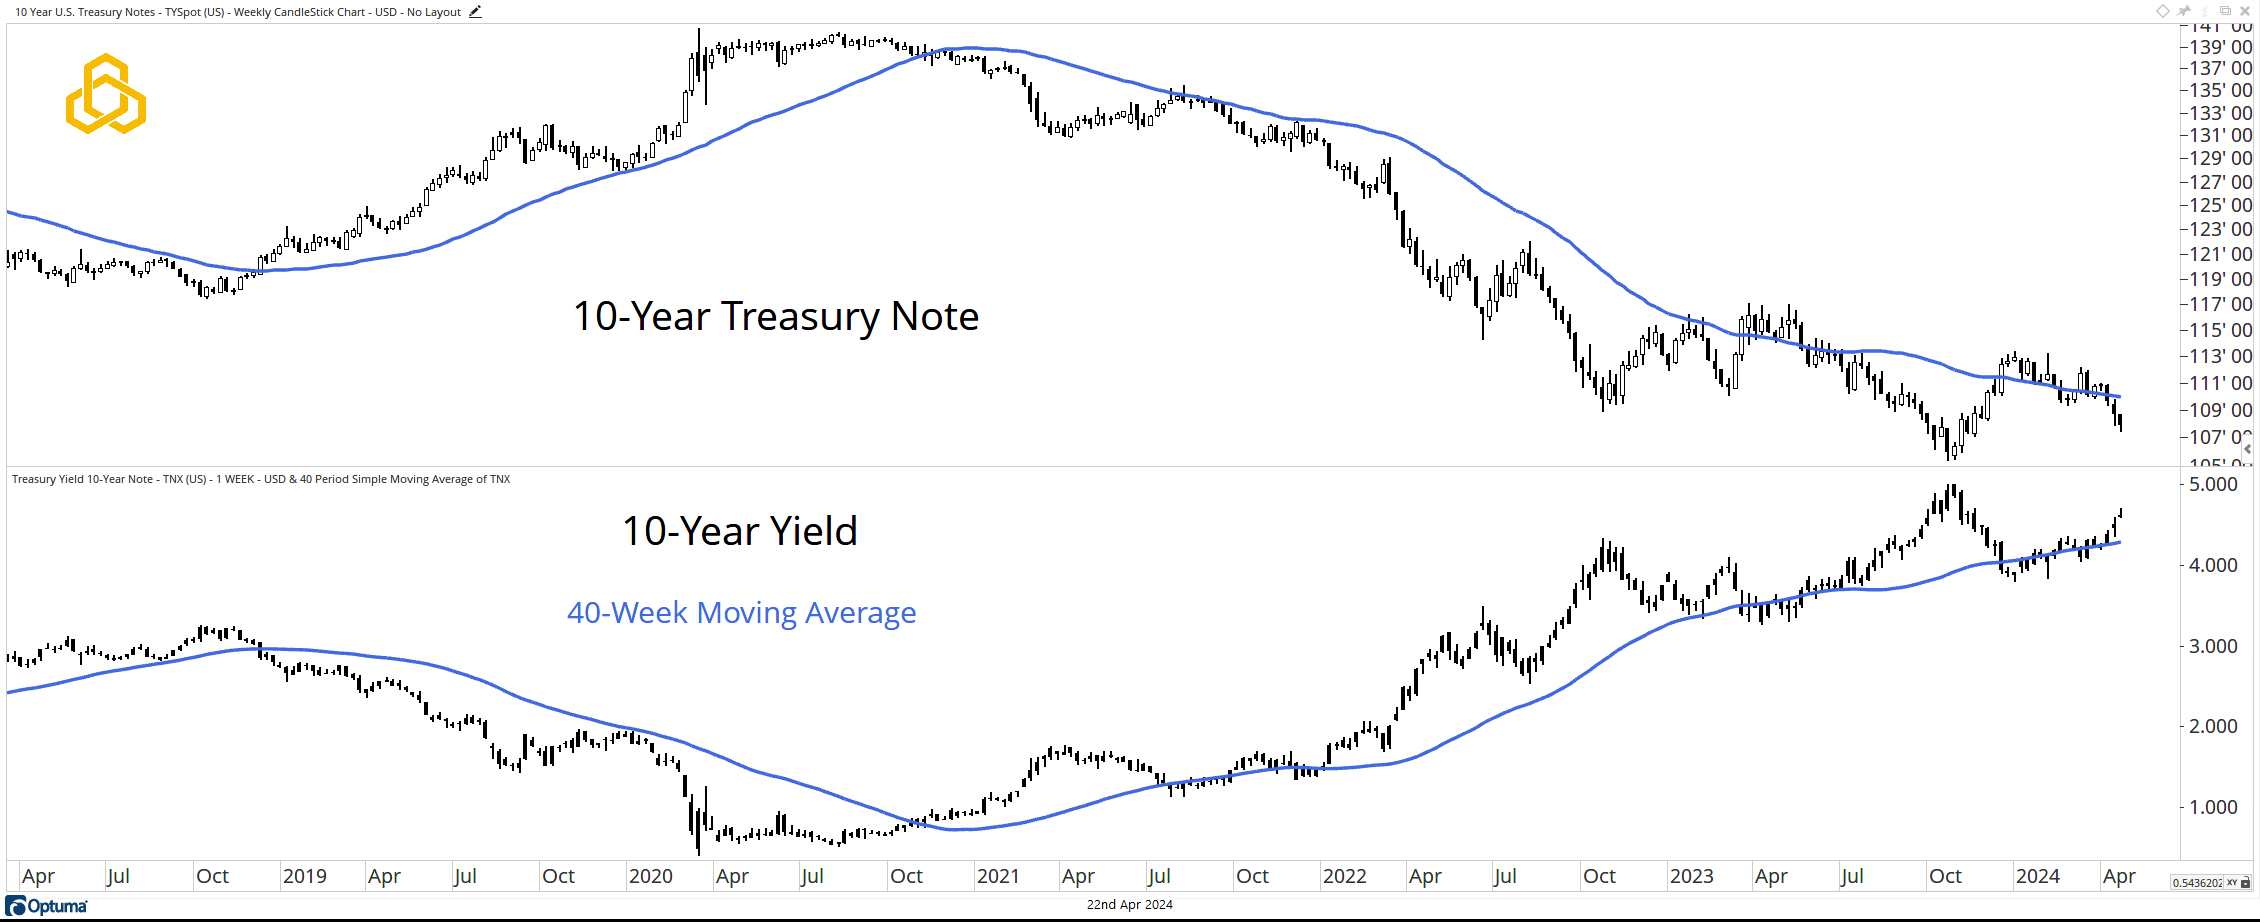
Ten-Year Note & Yield
Once again, as stocks fell, treasuries DID NOT provide shelter in the storm. The 10-Year Treasury Note (price) held below the declining 40-week moving average for a third consecutive week while the yield remains in an uptrend above a rising 40-week moving average.
The yield has eyes for 5% and as expectations of a rate cut in 2024 continue to fade, the odds of a move above that level grow.
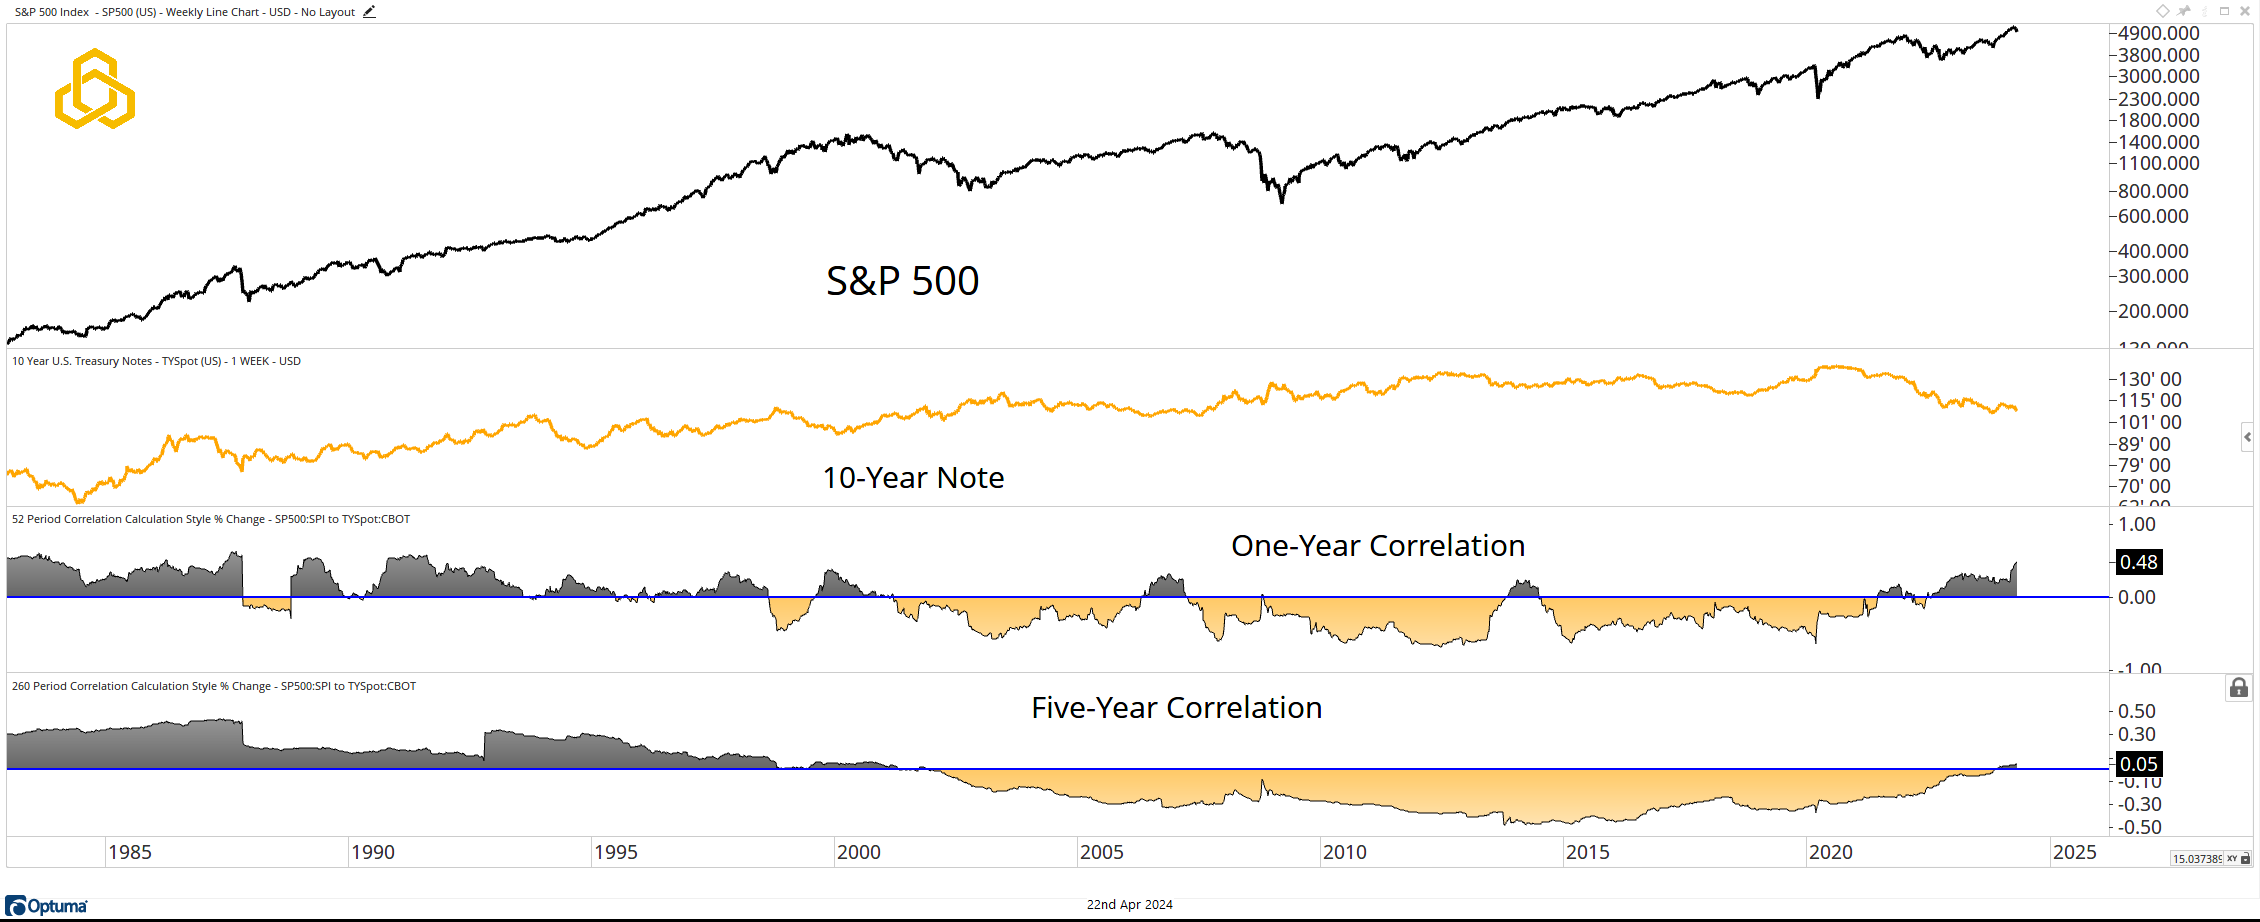
Stock Bond Correlation
The long-term regime shift in the stock/bond correlation continues to play out and we continue to feel that those who have come to rely on treasuries as a “hedge” to equity portfolios will be disappointed.
The one-year correlation has moved decisively higher over the past few weeks while the five-year correlation continues to grind in positive territory.
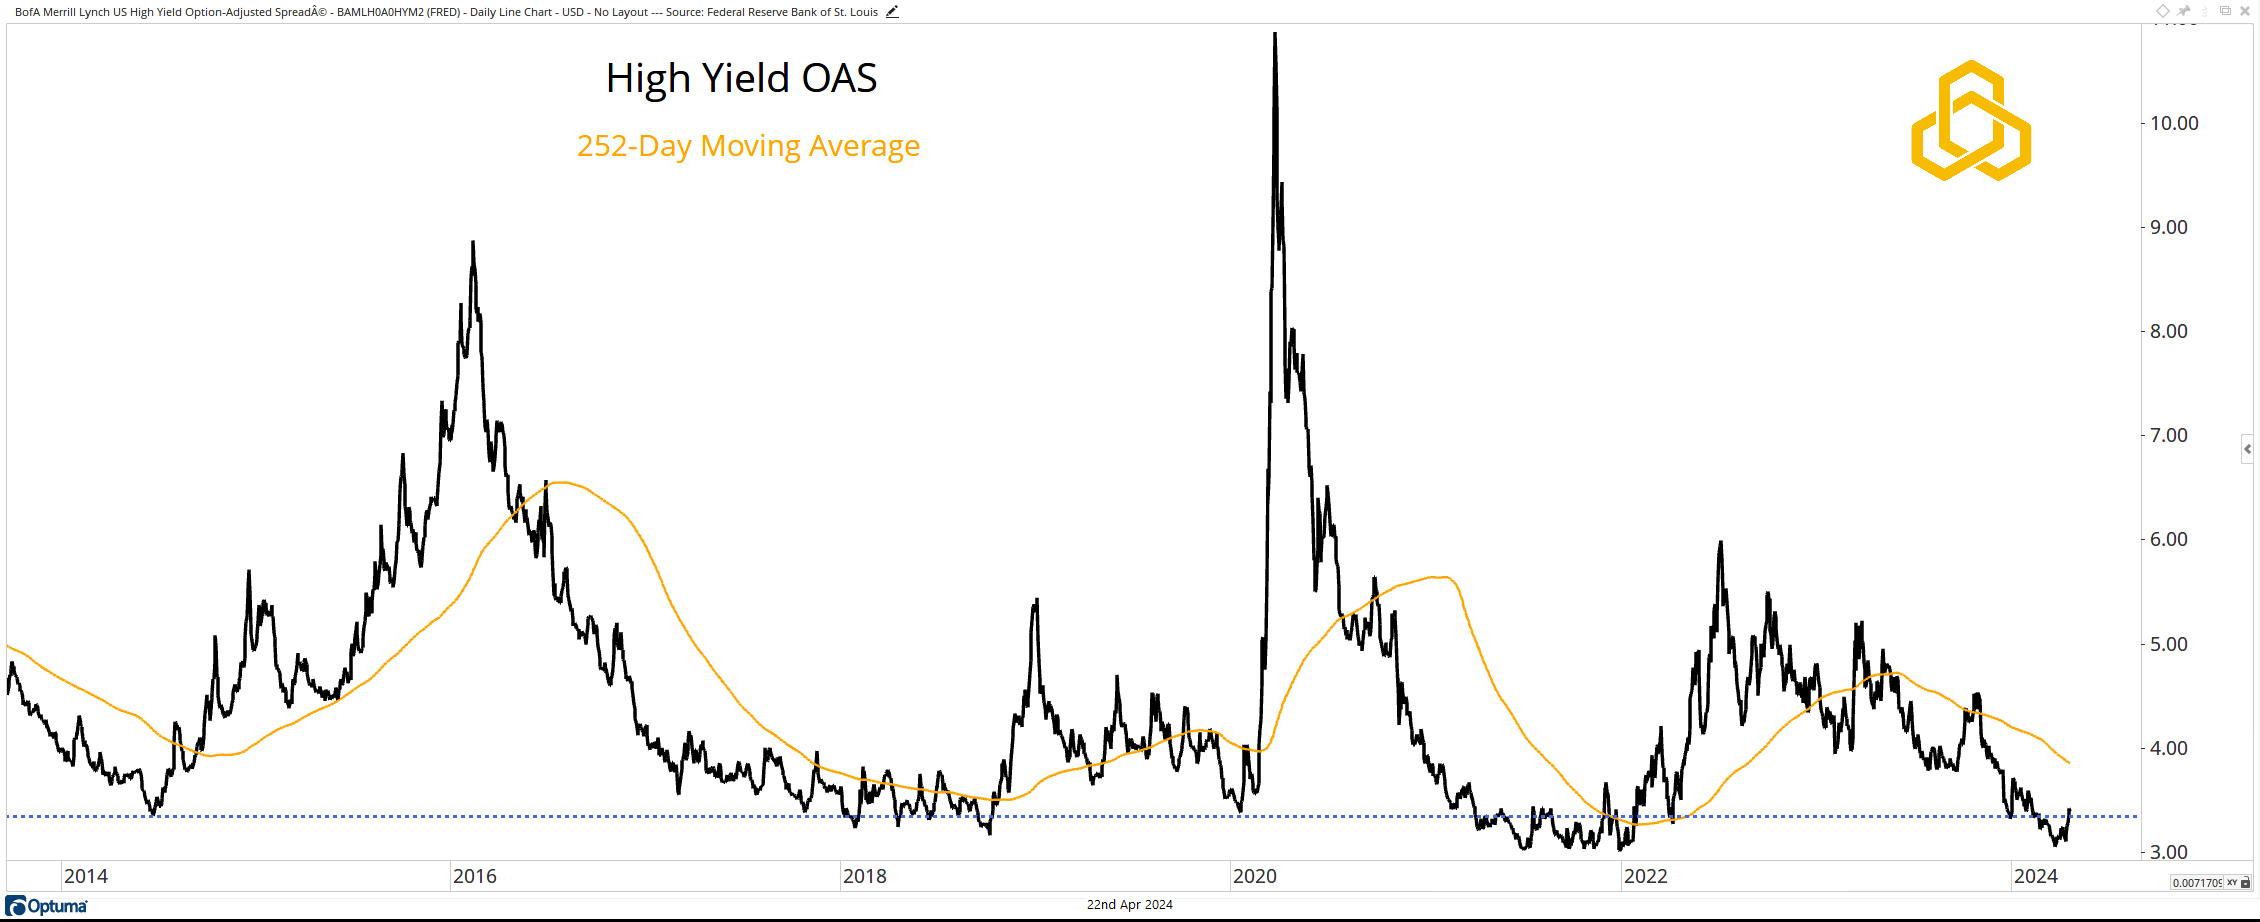
High Yield Spreads
The High-Yield OAS Spread has also been moving higher over the past few weeks. It remains below a falling one-year moving average, but we note that rallies from current levels preceded increases in equity market volatility in 2018 and 2022.
This is one to have on the radar as a sign of a possible shift to a higher volatility regime.
*All Charts from Optuma as of April 21, 2024. Past performance does not guarantee future results.
Disclosure: This information is prepared for general information only and should not be considered as individual investment advice nor as a solicitation to buy or offer to sell any securities. This material does not constitute any representation as to the suitability or appropriateness of any investment advisory program or security. Please visit our FULL DISCLOSURE page.
PFM-320-20240422