

Wall Street was abuzz with the news late Friday; a long-time bearish strategist from a major U.S. bank was no longer in his role on the investment committee. This strategist committed the cardinal sin for Street analysts; he was bearish and wrong. That combination introduces career risk that few are willing to take. At the same time, an extremely popular sports gambler/pizza reviewer has made an epic return to day-trading the stock market, a role that he undertook during the pandemic to great fanfare if not long-term investment success.
These two news items have the contrarians calling for a top in the market. Others who are more data-driven have taken to calling out divergences in the market as a reason to be bearish.
Regardless of the methodology, it is important to note that the index has not cracked yet.
S&P 500
Let’s start with the facts. The S&P 500, the index to which most investors are benchmarked, closed the week at a new all-time high. That is not bearish on its own. The index is above the rising 10 and 40-week moving averages.
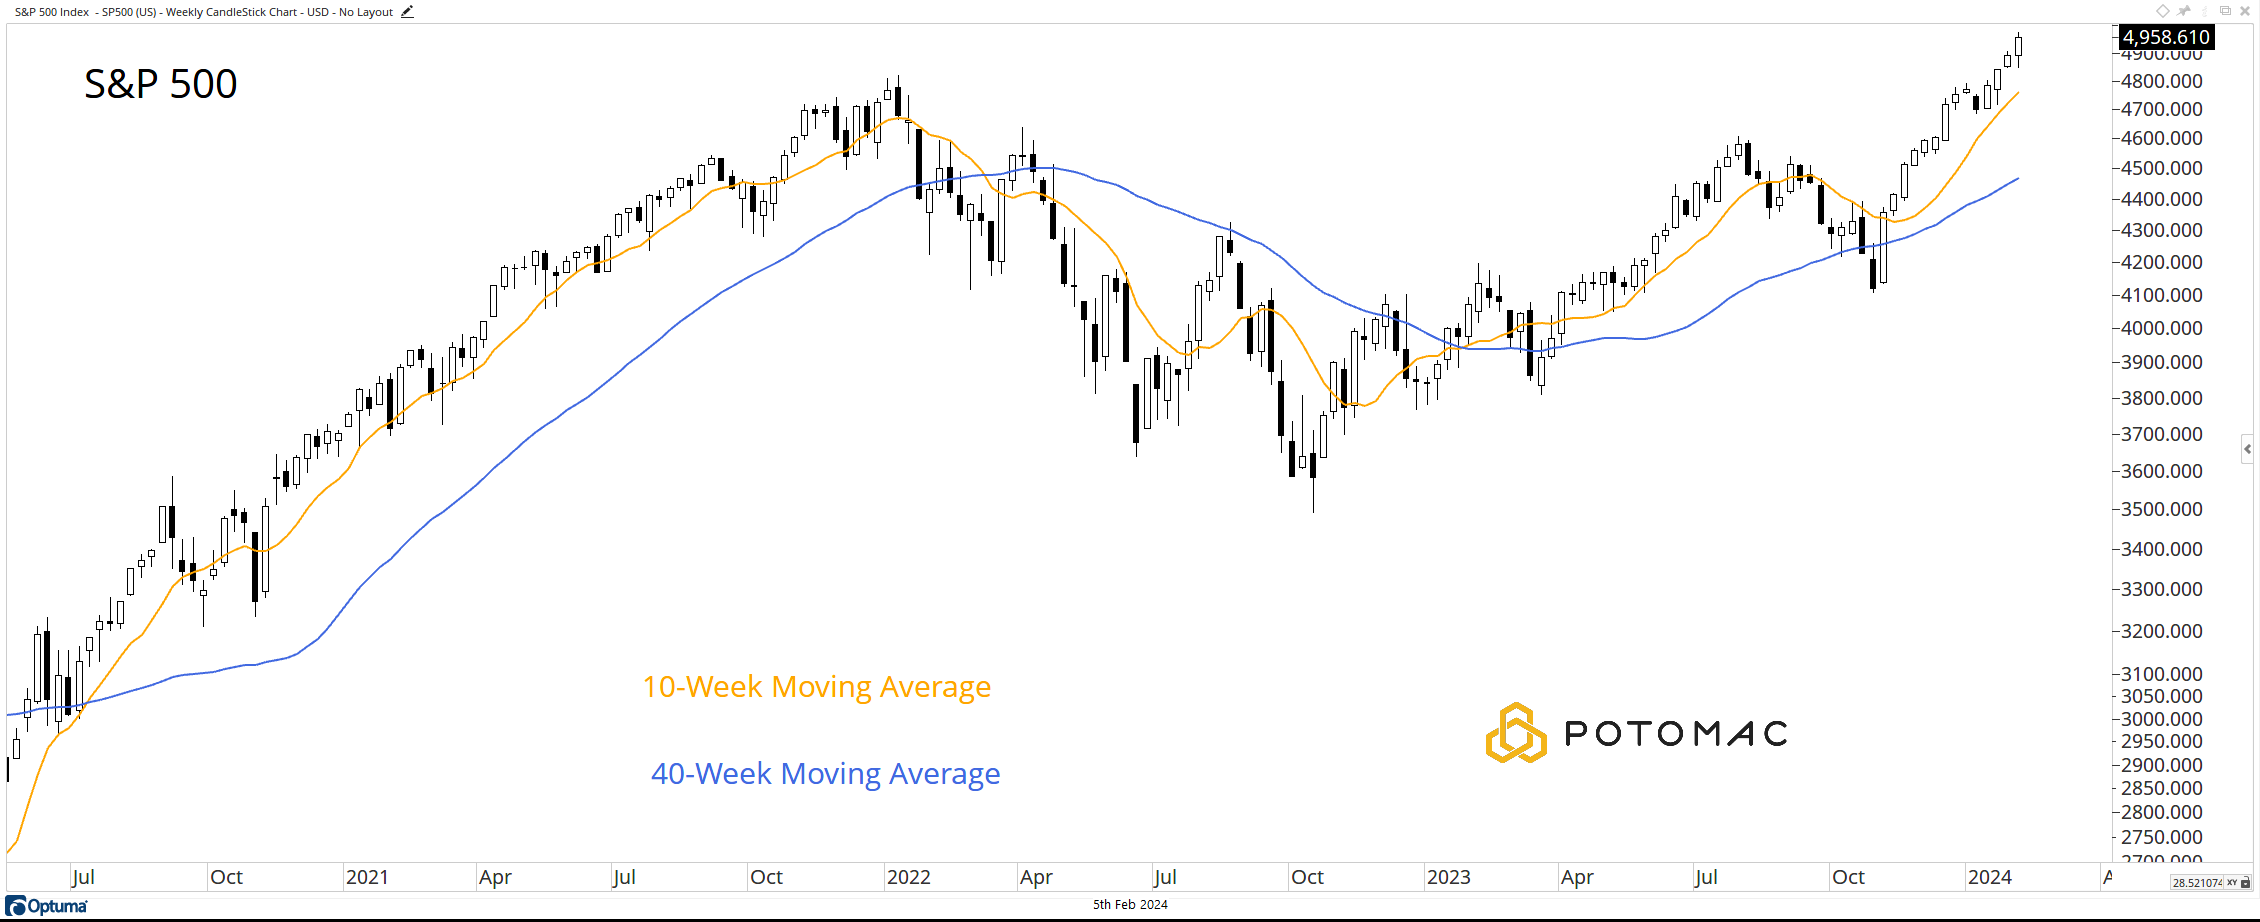
This being the case, why are people so eager to call a top?
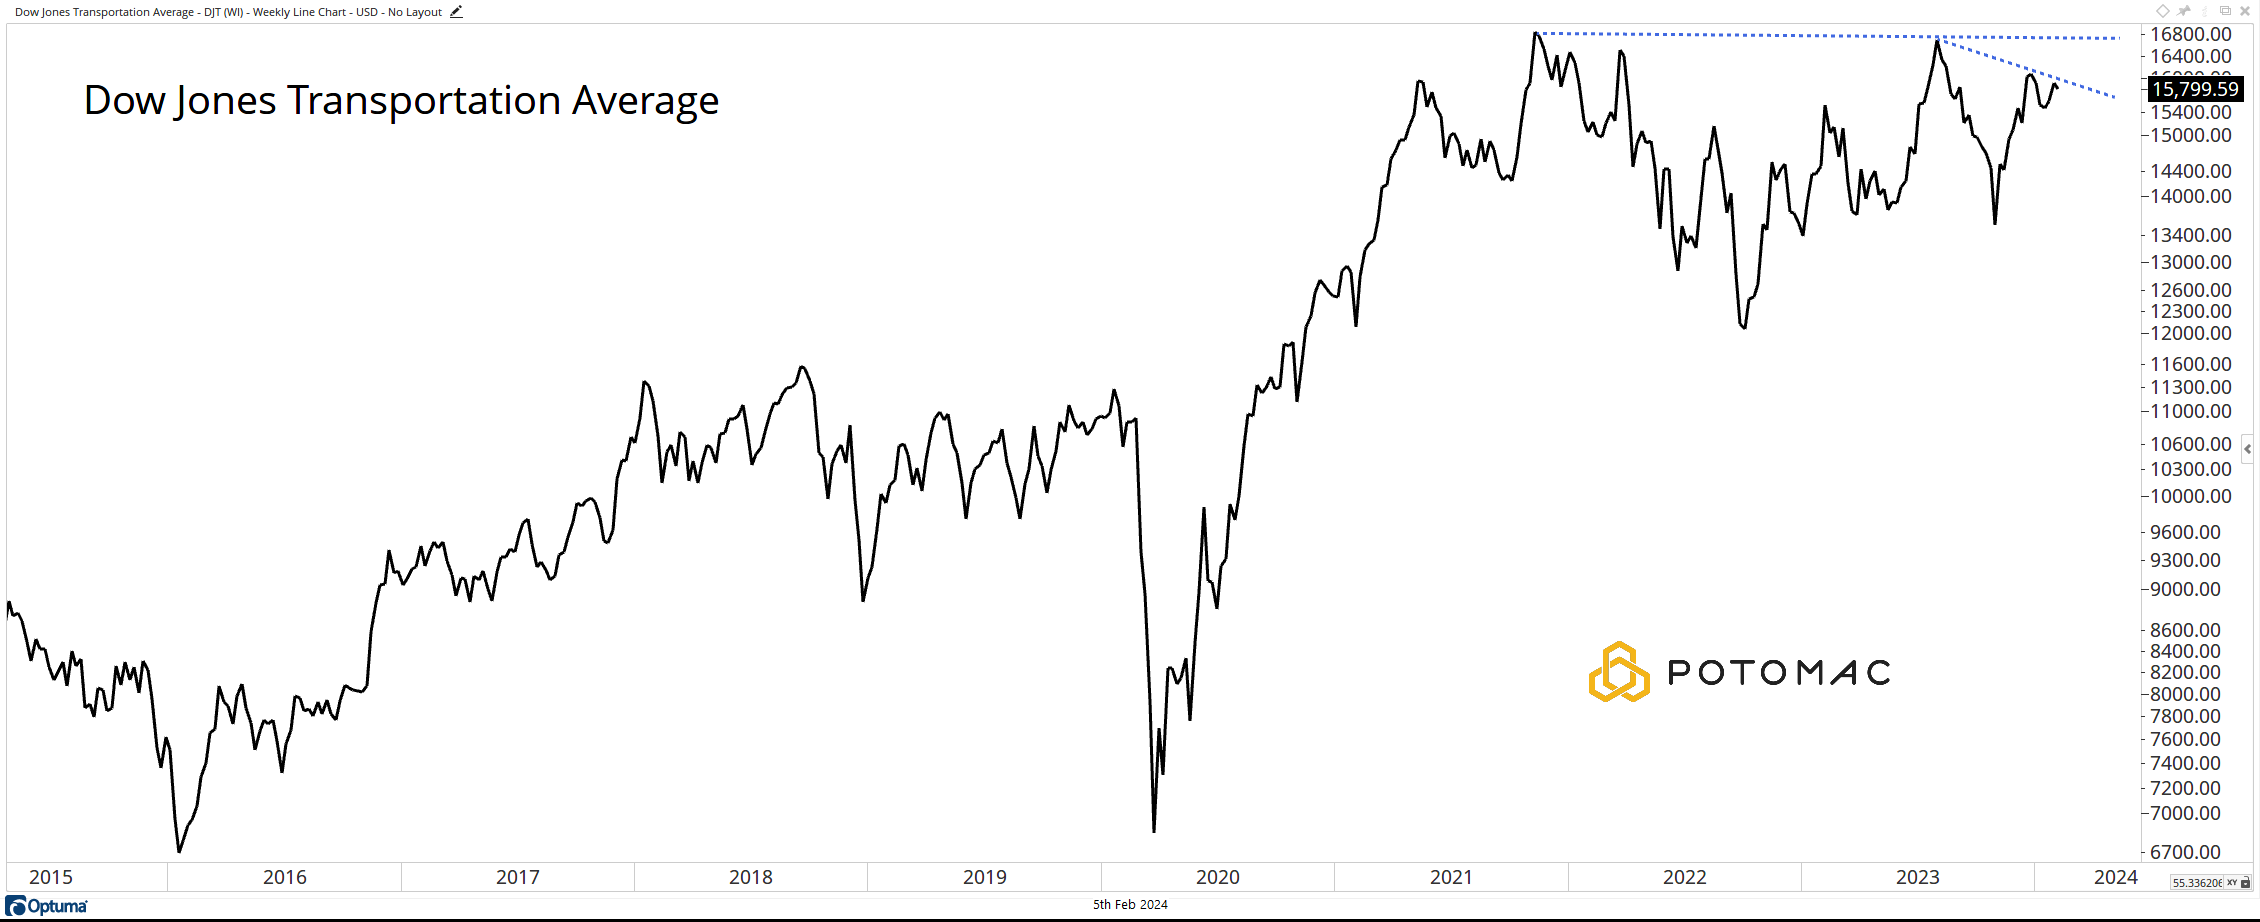
Divergence #1: Transports
This is one that has been in place for a long time and is admittedly important to our process at Potomac. As the broader equity market makes new highs, the Transports have not.
In fact, it has been more than two years since the last high. This divergence could signal that the broad market strength may not be as healthy as one index leads us to believe.
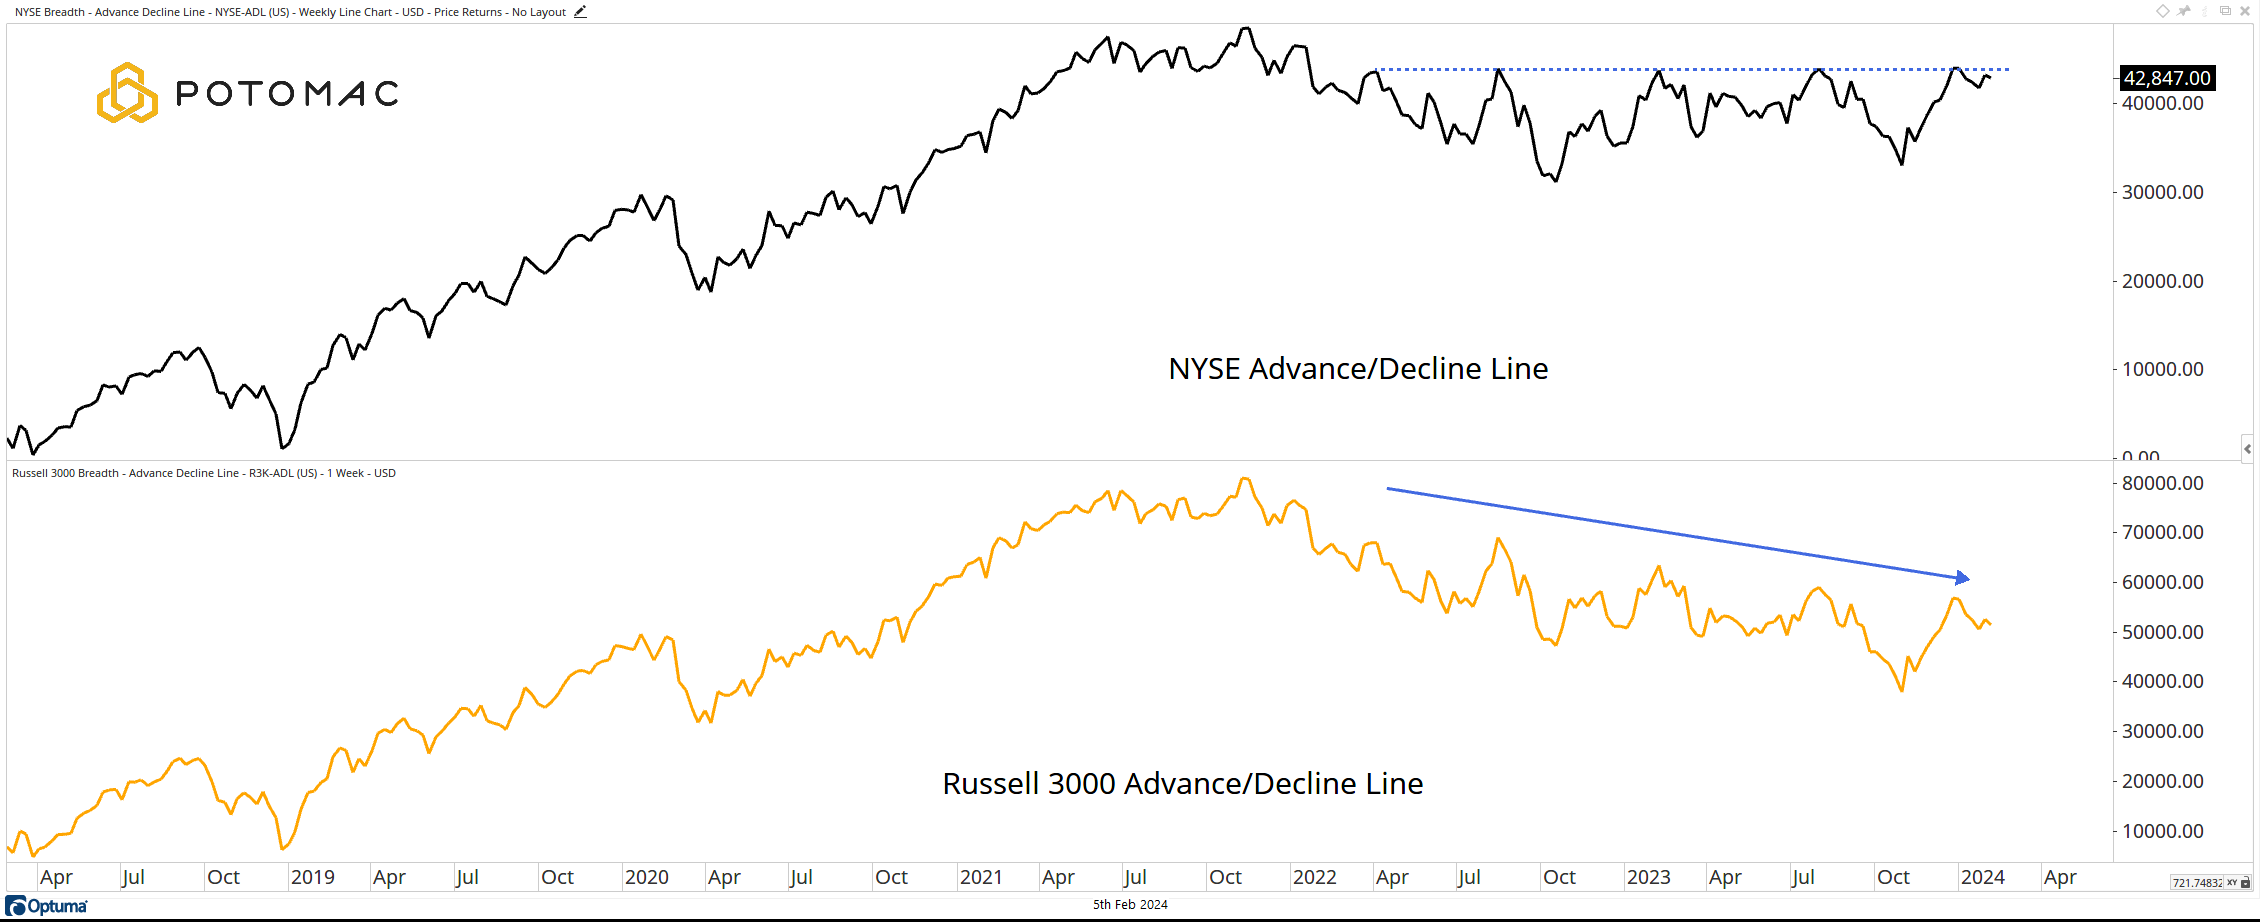
Divergence #2: The Advance/Decline Lines
This is another indicator that is important to our work. In a strong bull market, we expect to see a lot of stocks moving higher. Unfortunately for the bulls, this metric has been stuck in neutral for nearly two years.
The divergence in the A/D Line of the Russell 3000 is even more pronounced.
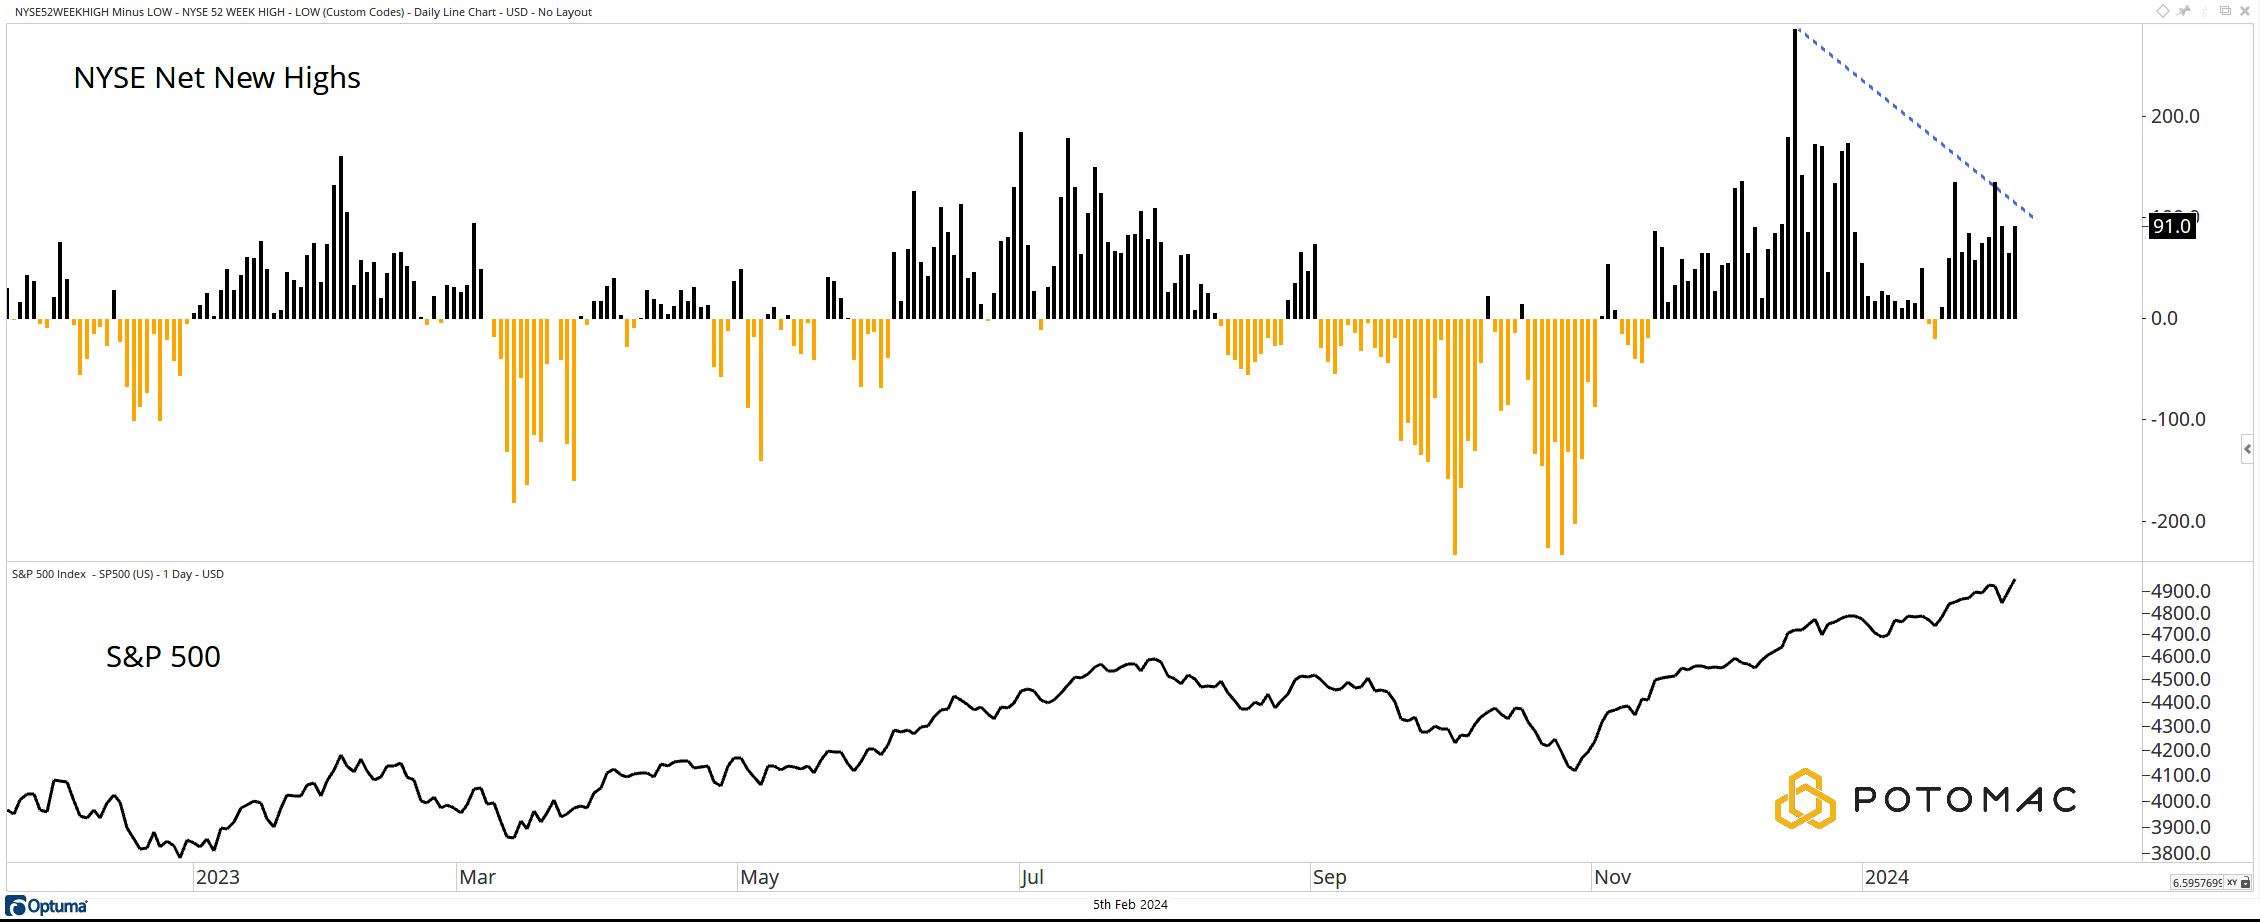
Divergence #3: Net New Highs
In a strong bull market, we want to see more stocks making new 52-week highs than making 52-week lows. Thus far, 2024 has not delivered the goods in this department.
The net new high indicator peaked in mid-December and while it has not turned persistently negative, it isn’t moving in the right direction.
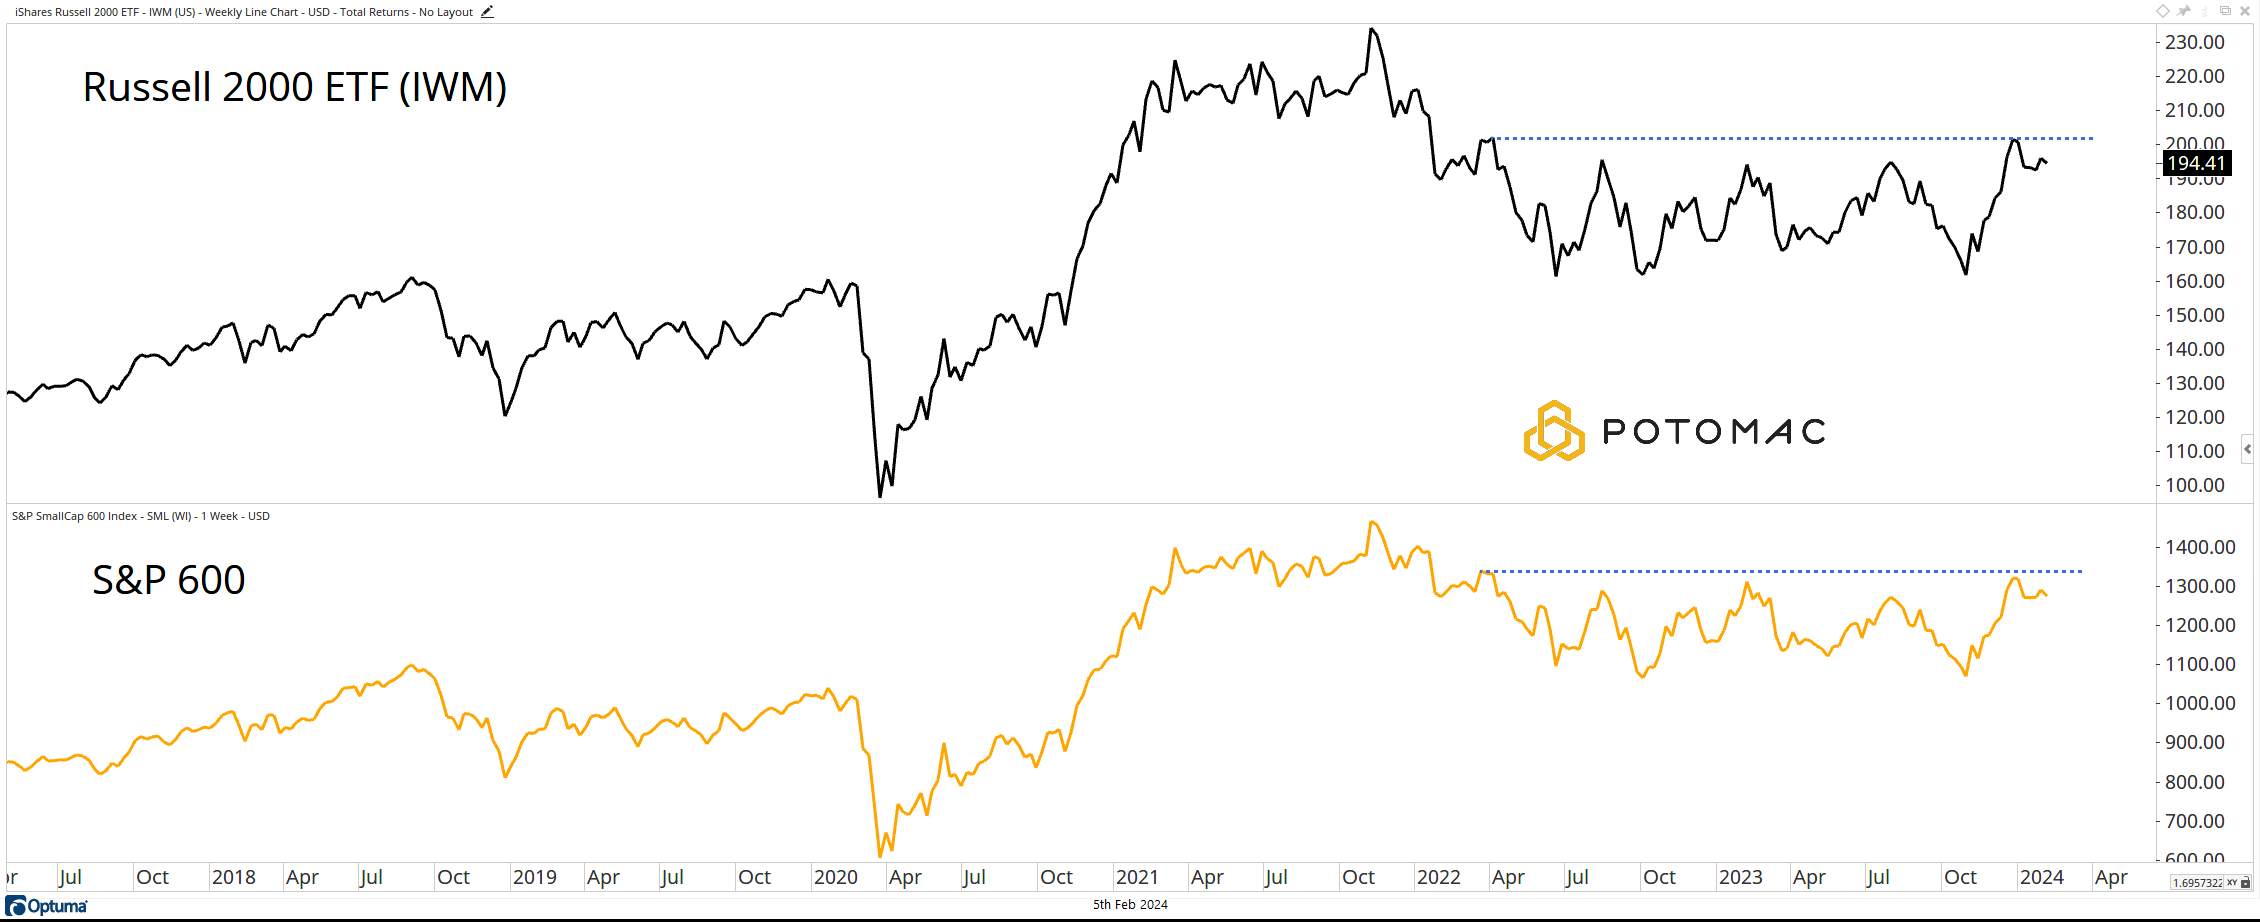
Divergence #4: Small Caps
The Russell 2000 has been stuck in a trading range since April 2022. Admittedly, this index holds a lot of low-quality stocks. Perhaps it is unfair to compare them to the biggest and best in the U.S.
However, when we look at the top of the small-cap universe, the S&P 600, we see a similar trend.
*All charts are from Optuma as of the close of trading on February 2, 2024. Past performance is not indicative of future results.
Potomac Fund Management ("Company") is an SEC-registered investment adviser. This information is prepared for general information only and should not be considered as individual investment advice nor as a solicitation to buy or offer to sell any securities. This material does not constitute any representation as to the suitability or appropriateness of any investment advisory program or security. Please visit our FULL DISCLOSURE page. The company does not make any representations or warranties as to the accuracy, timeliness, suitability, completeness, or relevance of any information prepared by any unaffiliated third party, whether linked to the Company website or incorporated herein, and takes no responsibility for any of this information. The views of the Company are subject to change and the Company is under no obligation to notify you of any changes. Different types of investments involve varying degrees of risk, and there can be no assurance that the future performance of any specific investment or investment strategy will be profitable or equal to any historical performance level.
PFM-304-20240205