

Well, here it is. After all the hype and anticipation, we are looking directly at Election Day in the United States. While I normally don’t do this, I feel compelled this year. At the end of this note, I will share my endorsement.
Past Election Years - Path
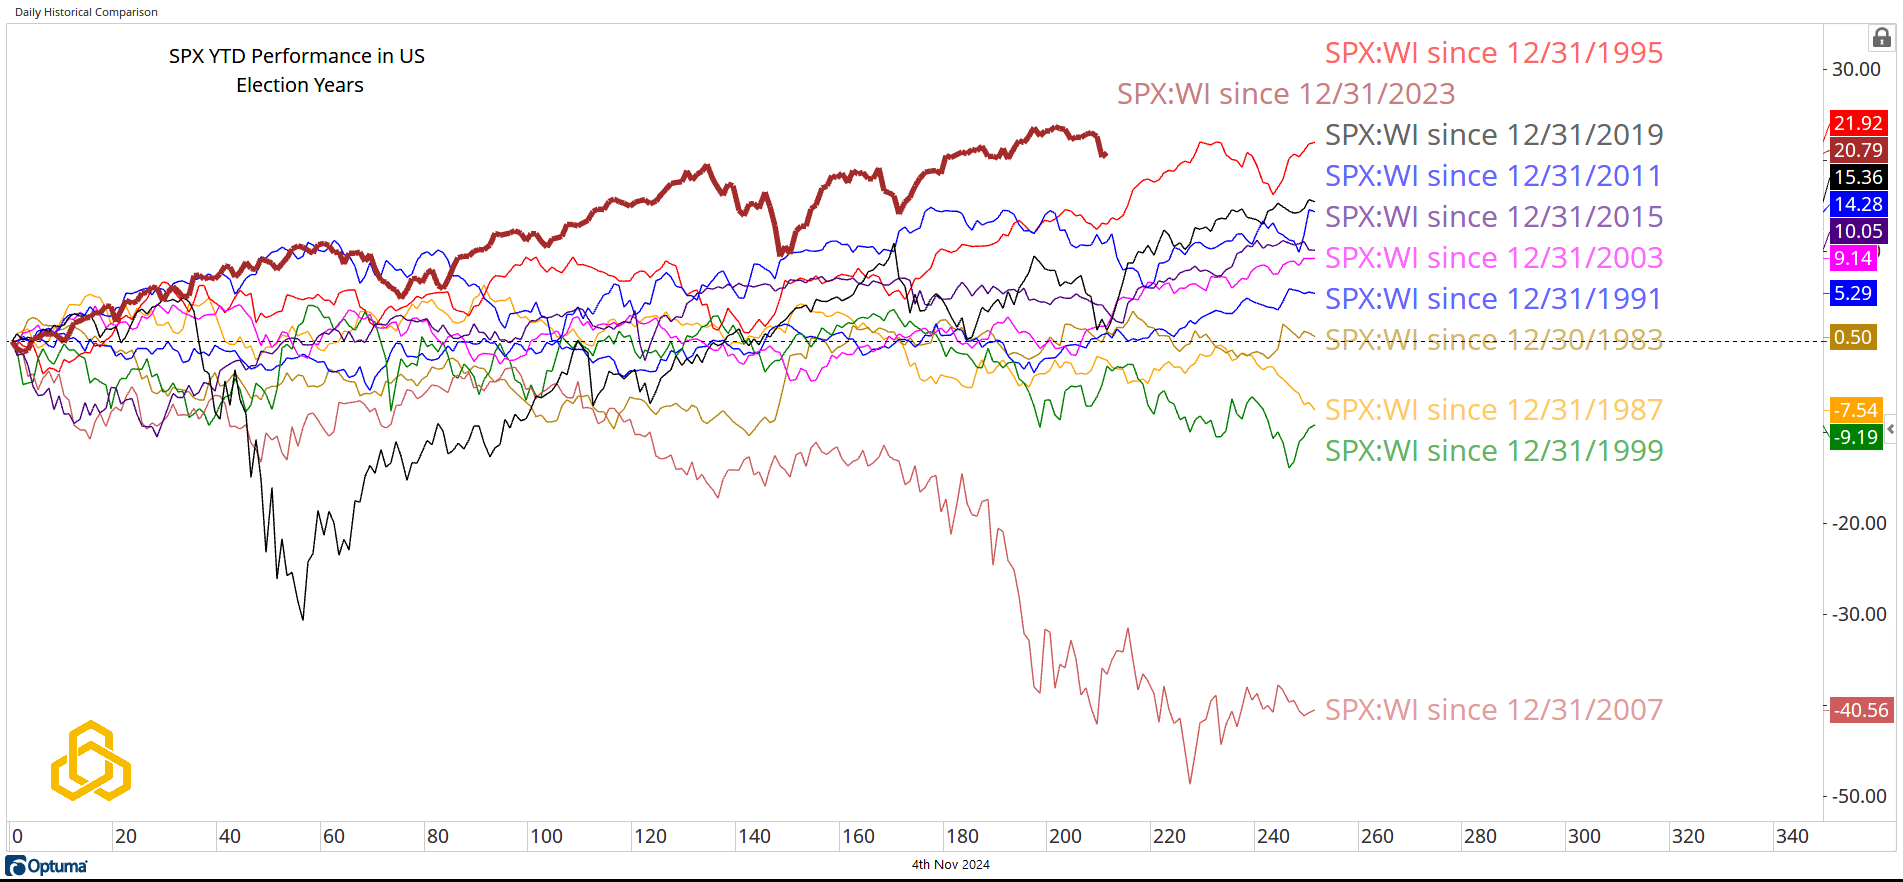
Below is an updated chart from Potomac’s Remix Conference last month, depicting past election years going back to 1984. Notably, 2024 has been an outperformer compared to other election years, even exceeding the boom times of 1996.
Performance from now to the end of the year is mixed but leans upward, especially if we ignore the 2008 Global Financial Crisis outlier.
Source: Optuma
S&P 500
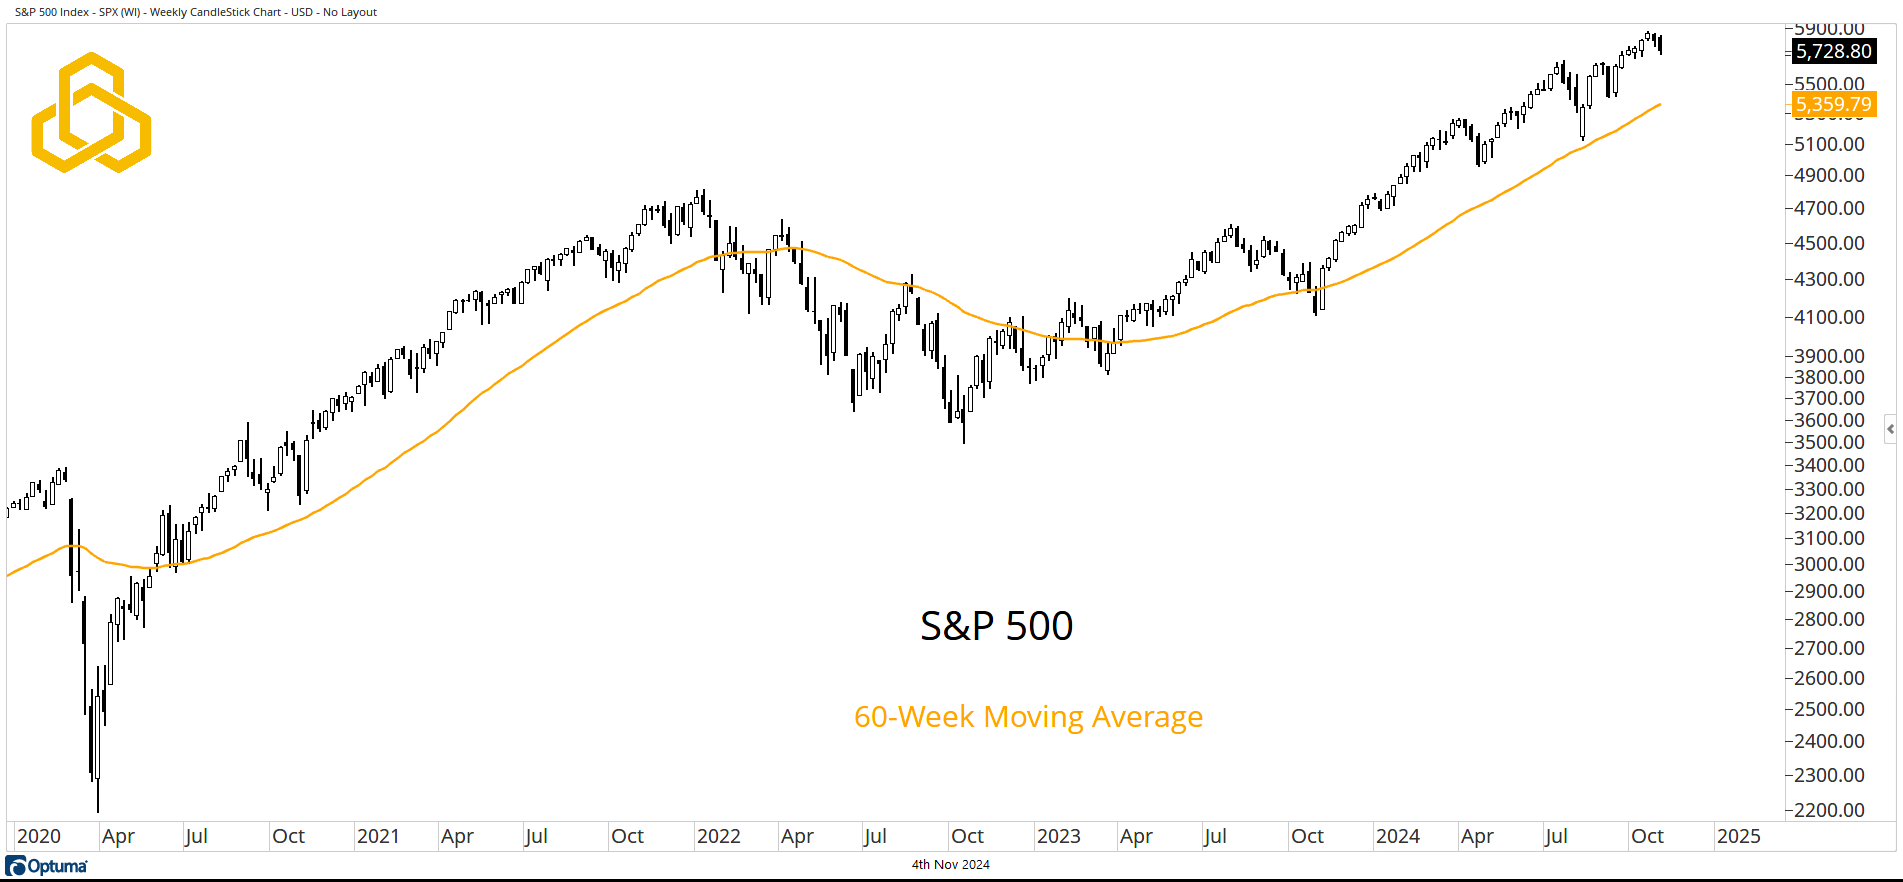
The trend for the S&P 500 remains bullish, with the index trading above a steadily rising 60-week moving average.
While it’s tempting to assign extra meaning to price movements this week, ask yourself this: If you were 10 years in the future, looking at a 20-year weekly chart of the S&P 500, would you be able to pick out the week of November 4, 2024, if there were no dates on the chart?
Source: Optuma
Breadth
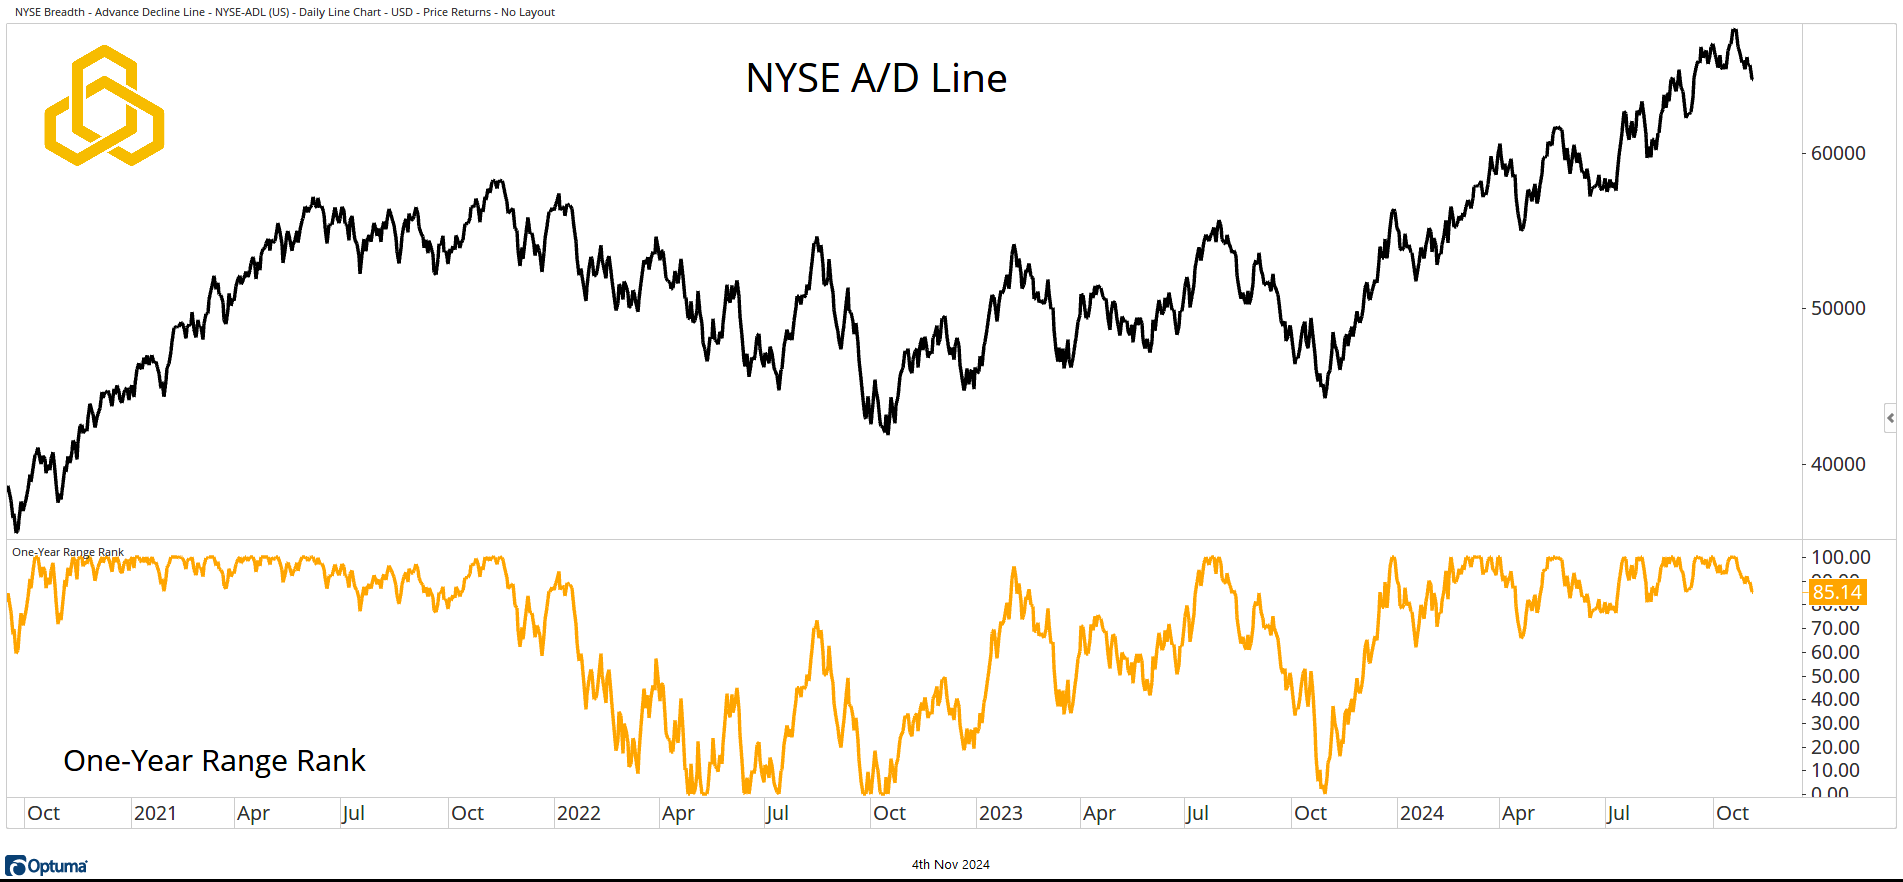
The NYSE Advance/Decline Line is still in an uptrend despite pulling back over the past two weeks. The one-year range rank for the indicator is at 85.14. A reading of 100 would mean a one-year high, while a reading of 0 would signal a one-year low.
Source: Optuma
Volatility
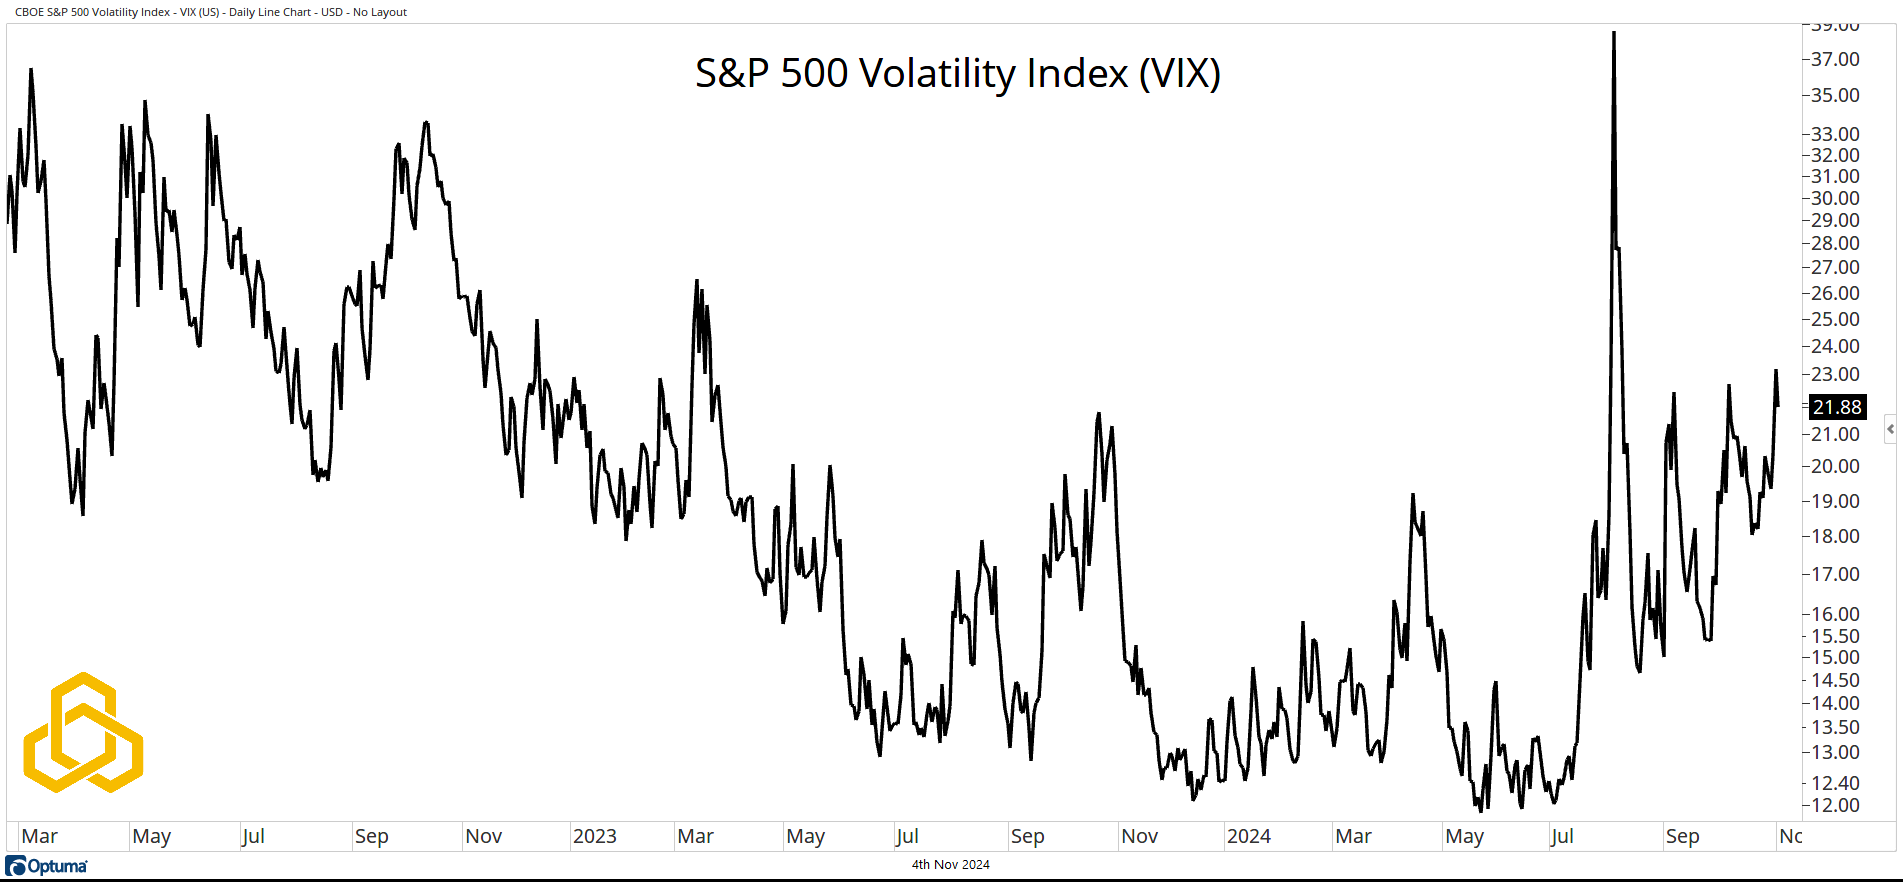
The volatility market, as measured by the S&P 500 Volatility Index (VIX), remains heightened ahead of the election. We know that the market hates uncertainty, but I’d argue that every day is uncertain. The current VIX reading, 21.88, implies 1.37% daily moves for the S&P 500 over the next month of trading, even though the “event risk” is tomorrow.
Source: Optuma
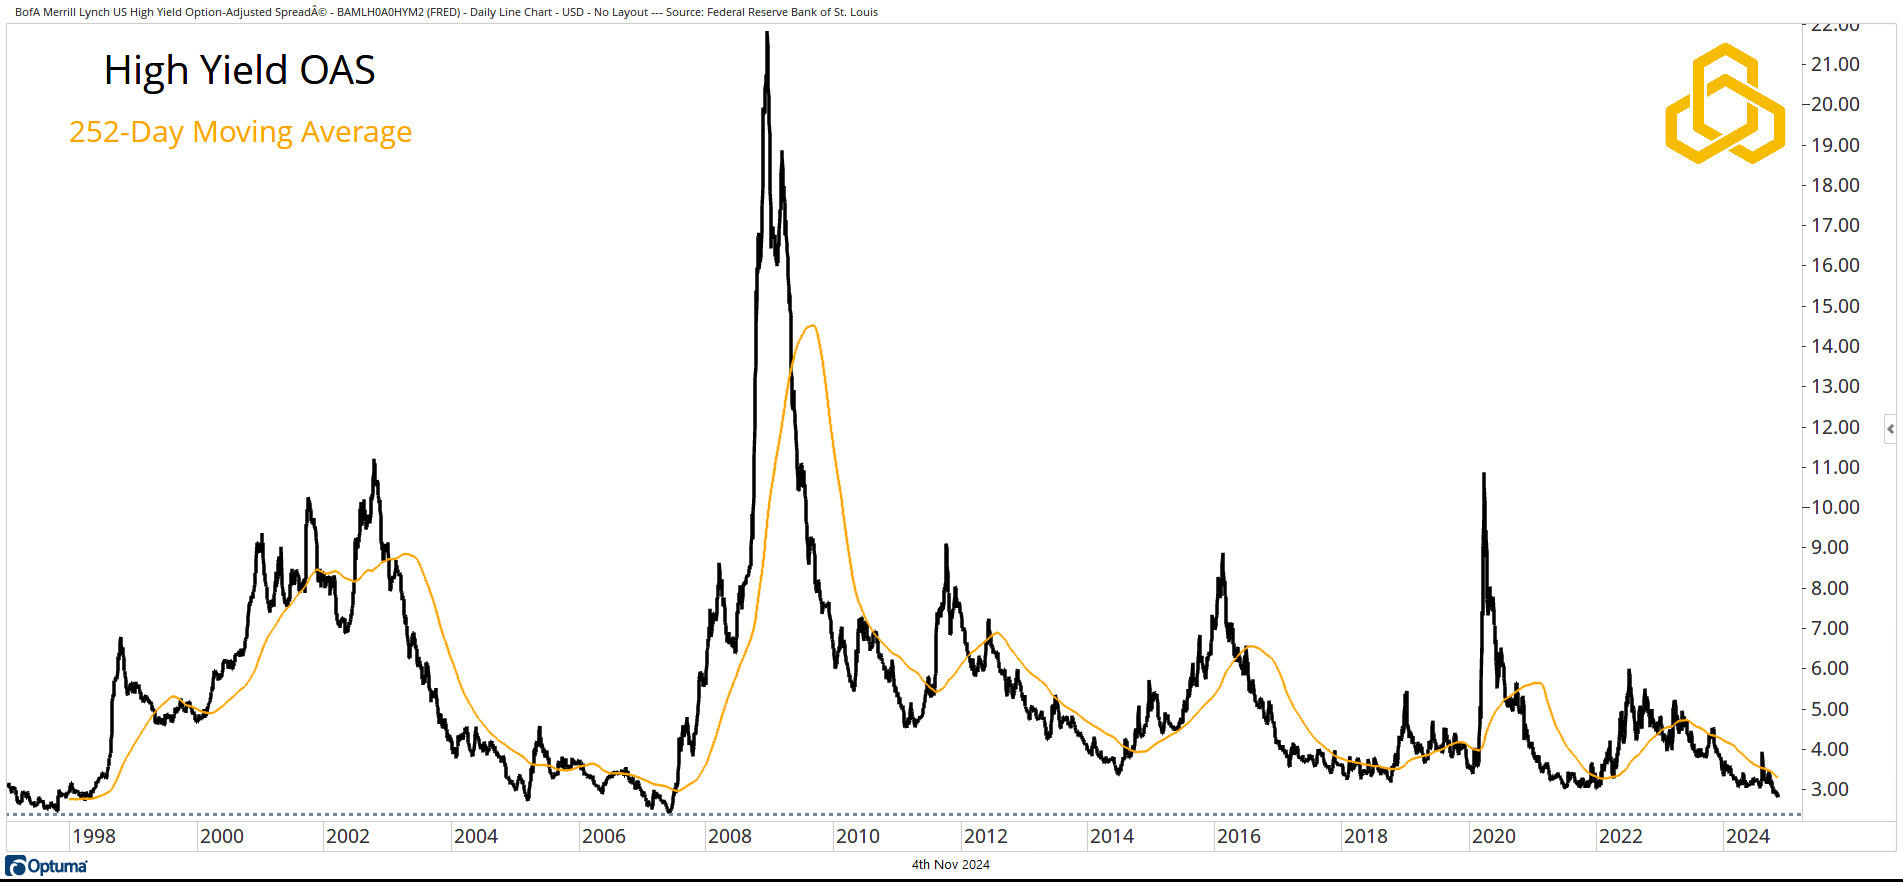
Credit Spreads
While the VIX signals some near-term apprehension, Credit Spreads tell a different story. The High Yield Option Adjusted Spread (the difference between junk yields and treasuries) is below the declining one-year moving average and heading toward the “tight” levels seen in 1997 and 2007.
Source: Optuma
And now, as promised…my endorsement!
PRICE—as in, the price trends of the assets I care about.
The trend in the market is more important than anything else. Anyone making investment decisions based on an election outcome is likely to make a costly mistake for themselves and/or their clients.
Disclosure: This information is prepared for general information only and should not be considered as individual investment advice nor as a solicitation to buy or offer to sell any securities. This material does not constitute any representation as to the suitability or appropriateness of any investment advisory program or security. Please visit our FULL DISCLOSURE page.
PFM-371-20241104