
Sometimes, people fall into the trap of writing about complex topics that are off the beaten path to be different or prove that they are adding nuance to the discussion to add value.
However, more and more, I am coming around to the idea that simple is better.
As we ease into the start of Summer 2024, that is what we are going to do with these weekly notes; keep it simple while also being laser-focused on what matters: the trend, the health of the trend, and confirmation of the trend.
For now, we can say that trends are bullish, healthy, and confirmation is mixed.
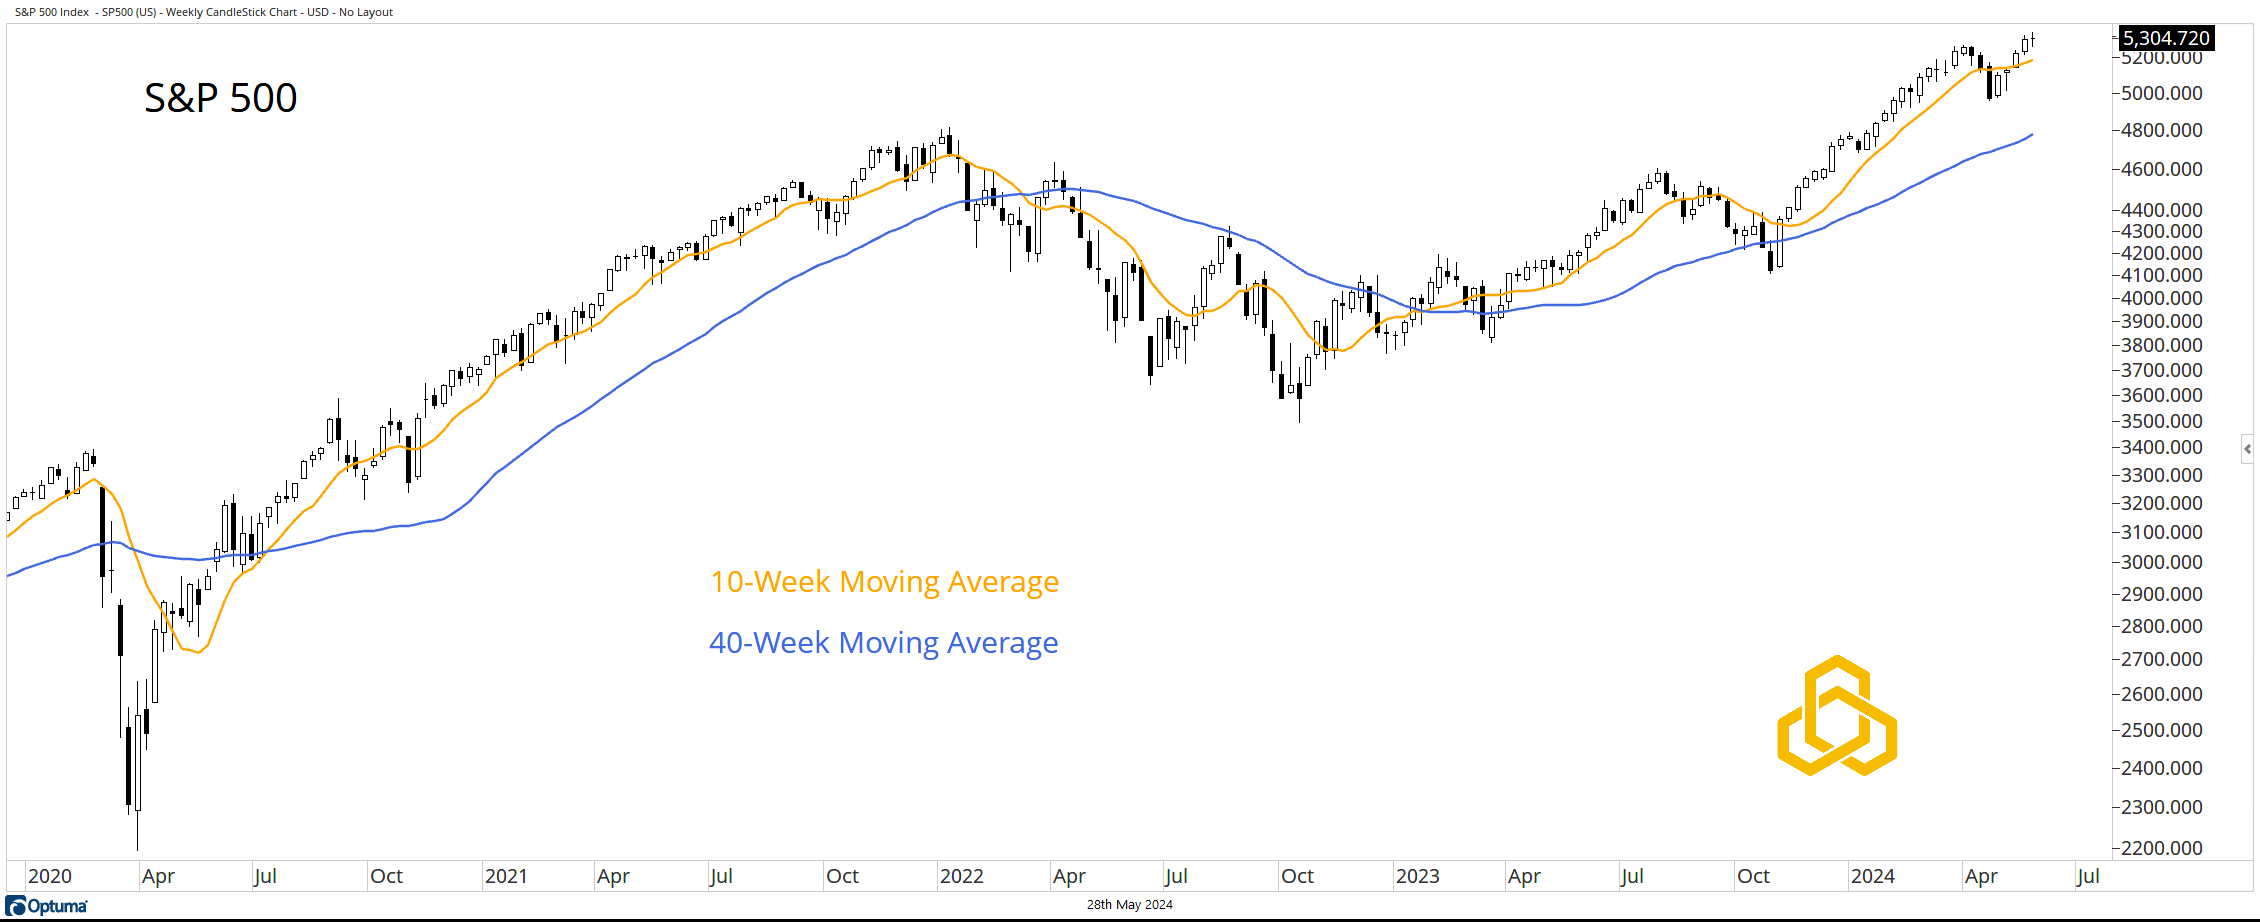
S&P 500
The weekly chart of the S&P 500 is not complicated. The index traded at an all-time high last week and, despite closing in the middle of the weekly range, remains above its rising 10- and 40-week moving averages.
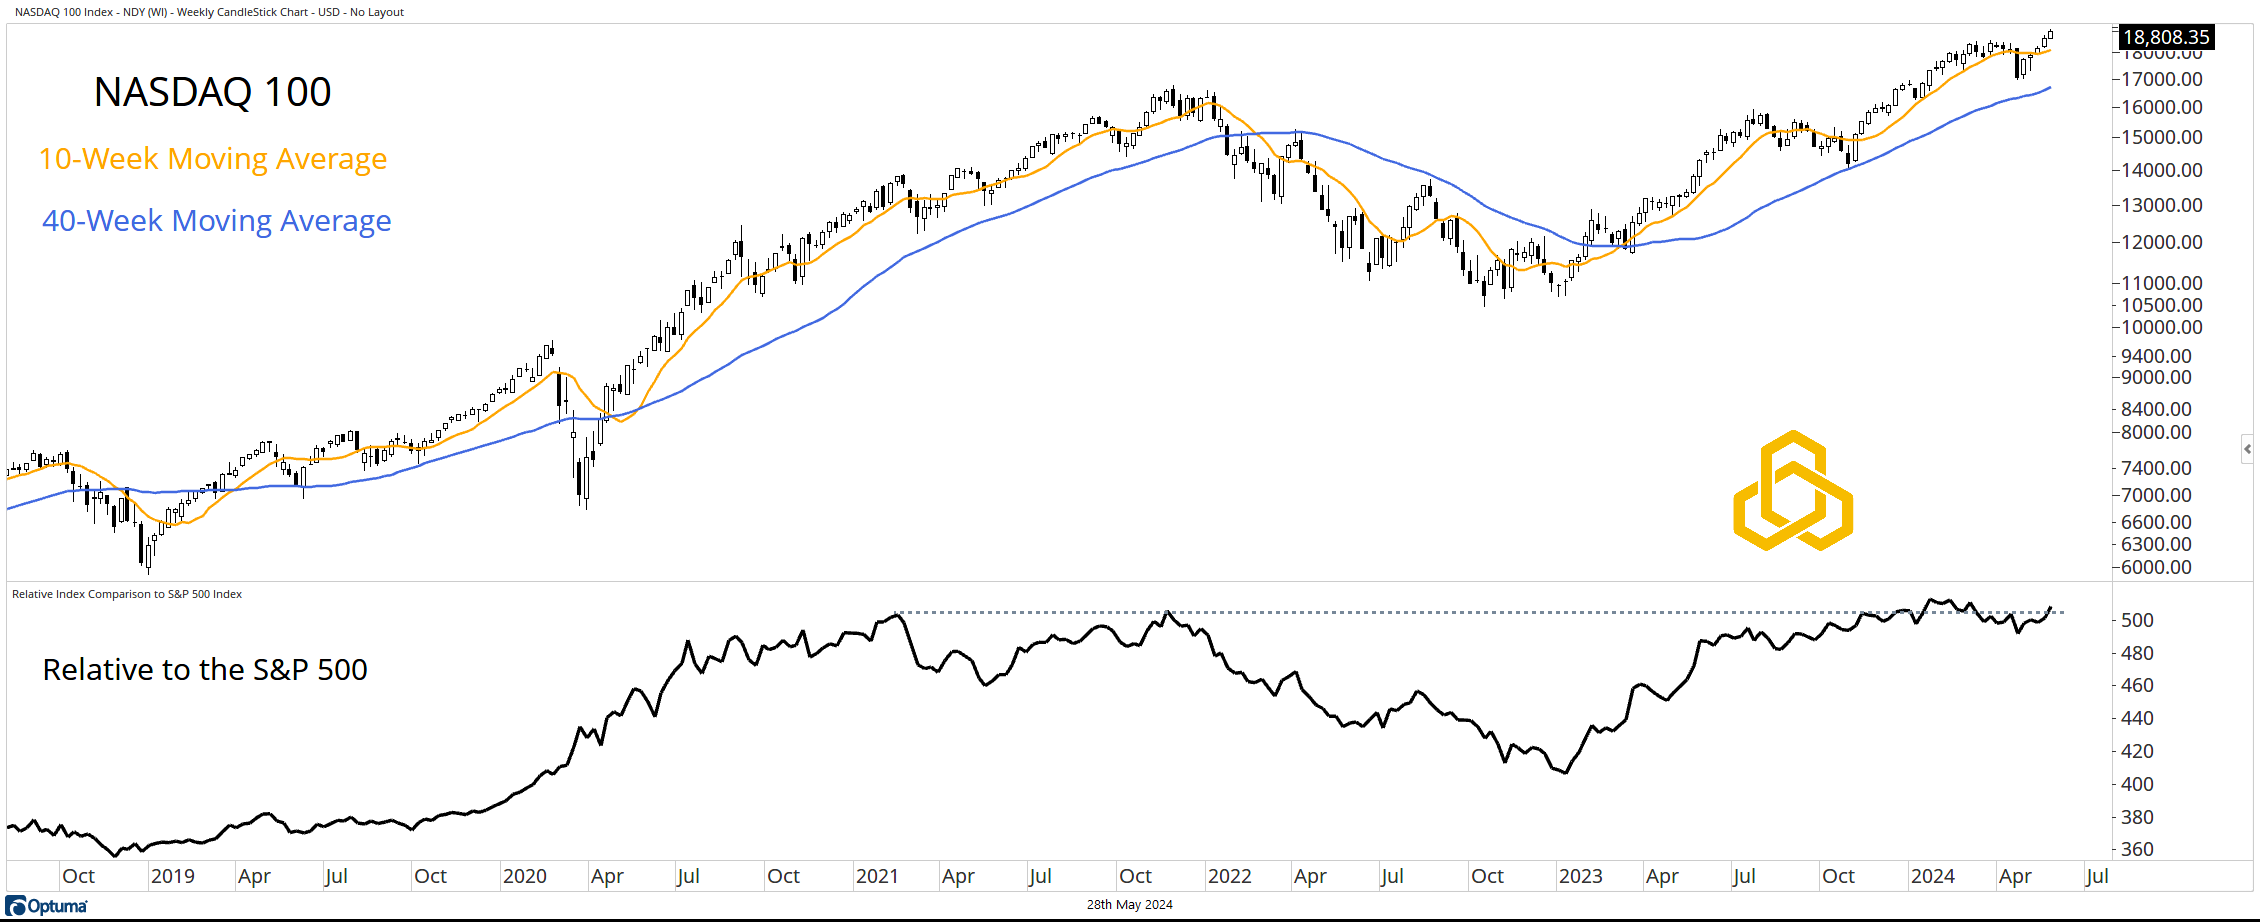
NASDAQ 100
The NASDAQ 100 Index closed at record levels last week, above the rising 10- and 40-week moving averages. It is hard to argue record highs are bearish. At the same time, the relative trend (vs. the S&P 500) is on the verge of breaking above the top of the consolidation zone that has been in place since February 2021.
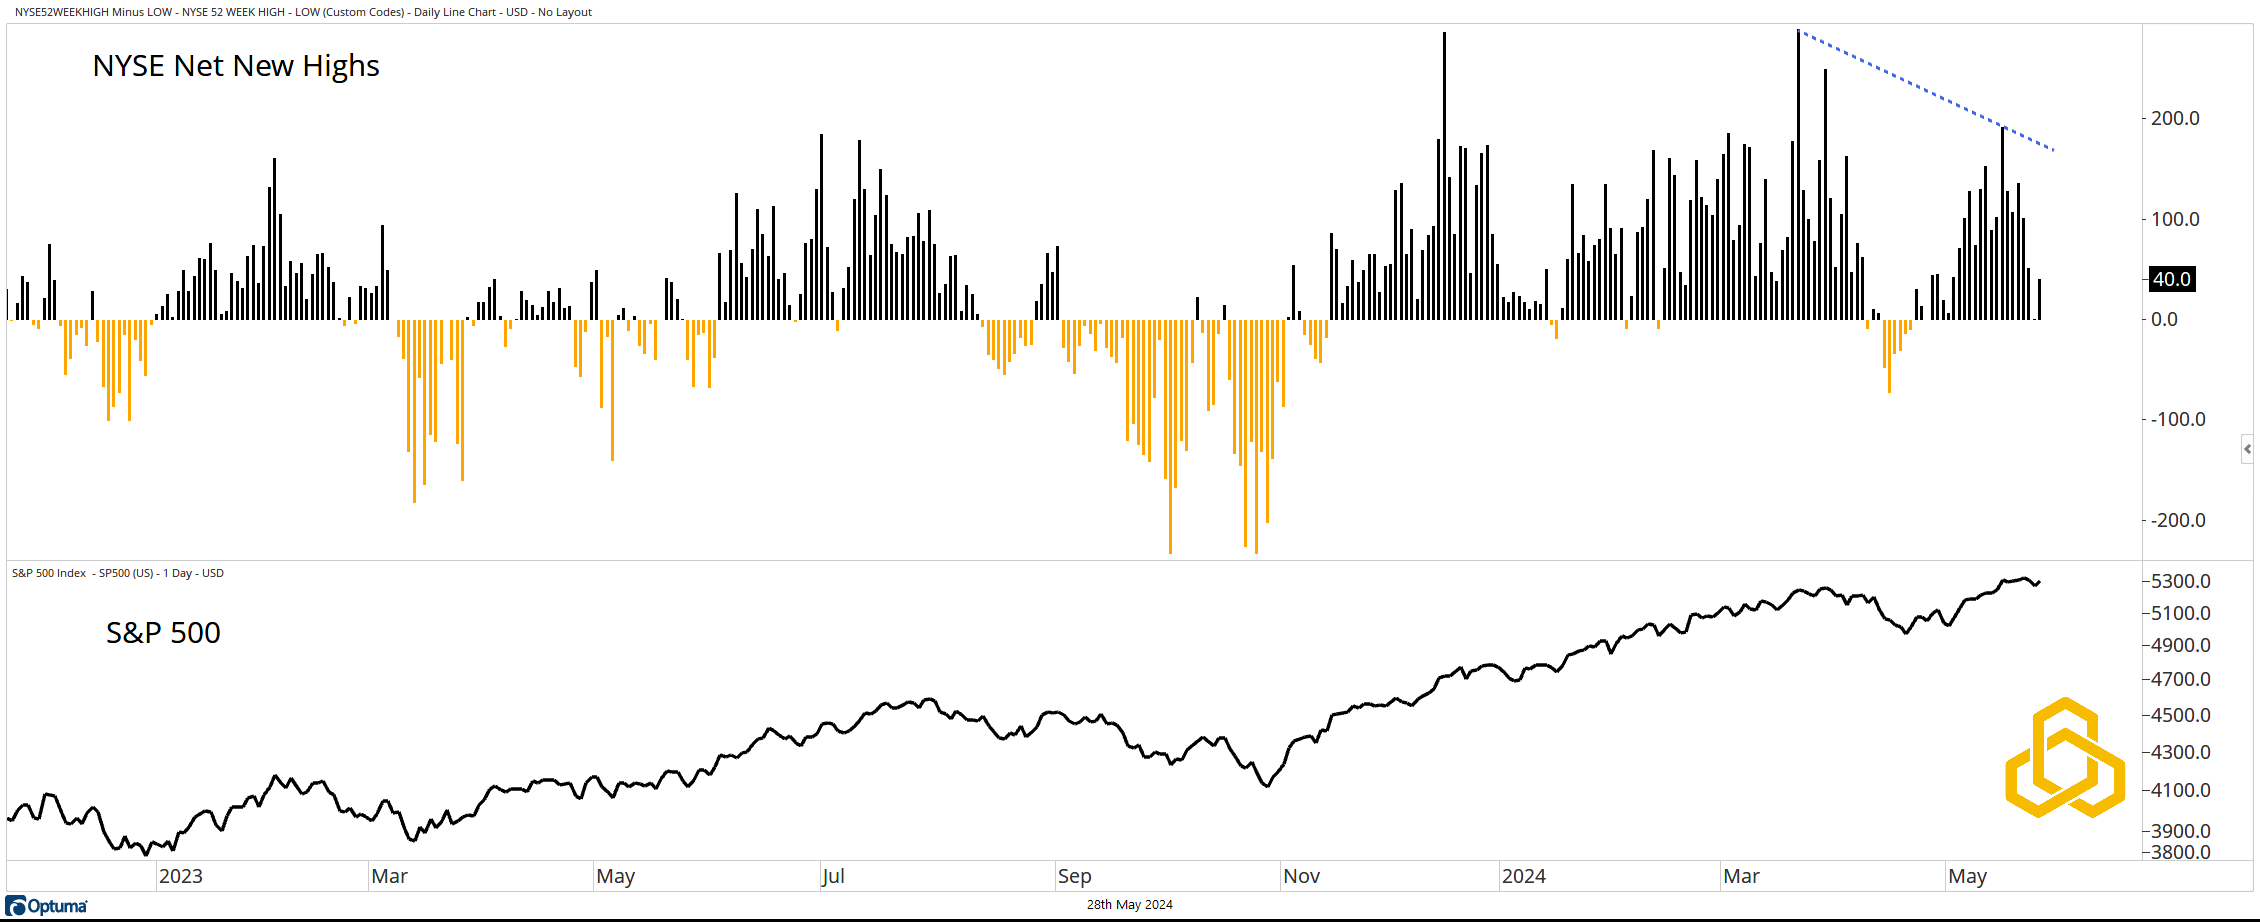
NYSE Net New Highs
For most of 2024, there have been more stocks on the NYSE making new highs than making new lows; arguably a bullish dynamic for the health of equity price trends. If we wanted to pick on this metric, we would point out that the recent readings have been lower than those seen in March despite the indices trading higher. However, that would only be a mild warning sign.
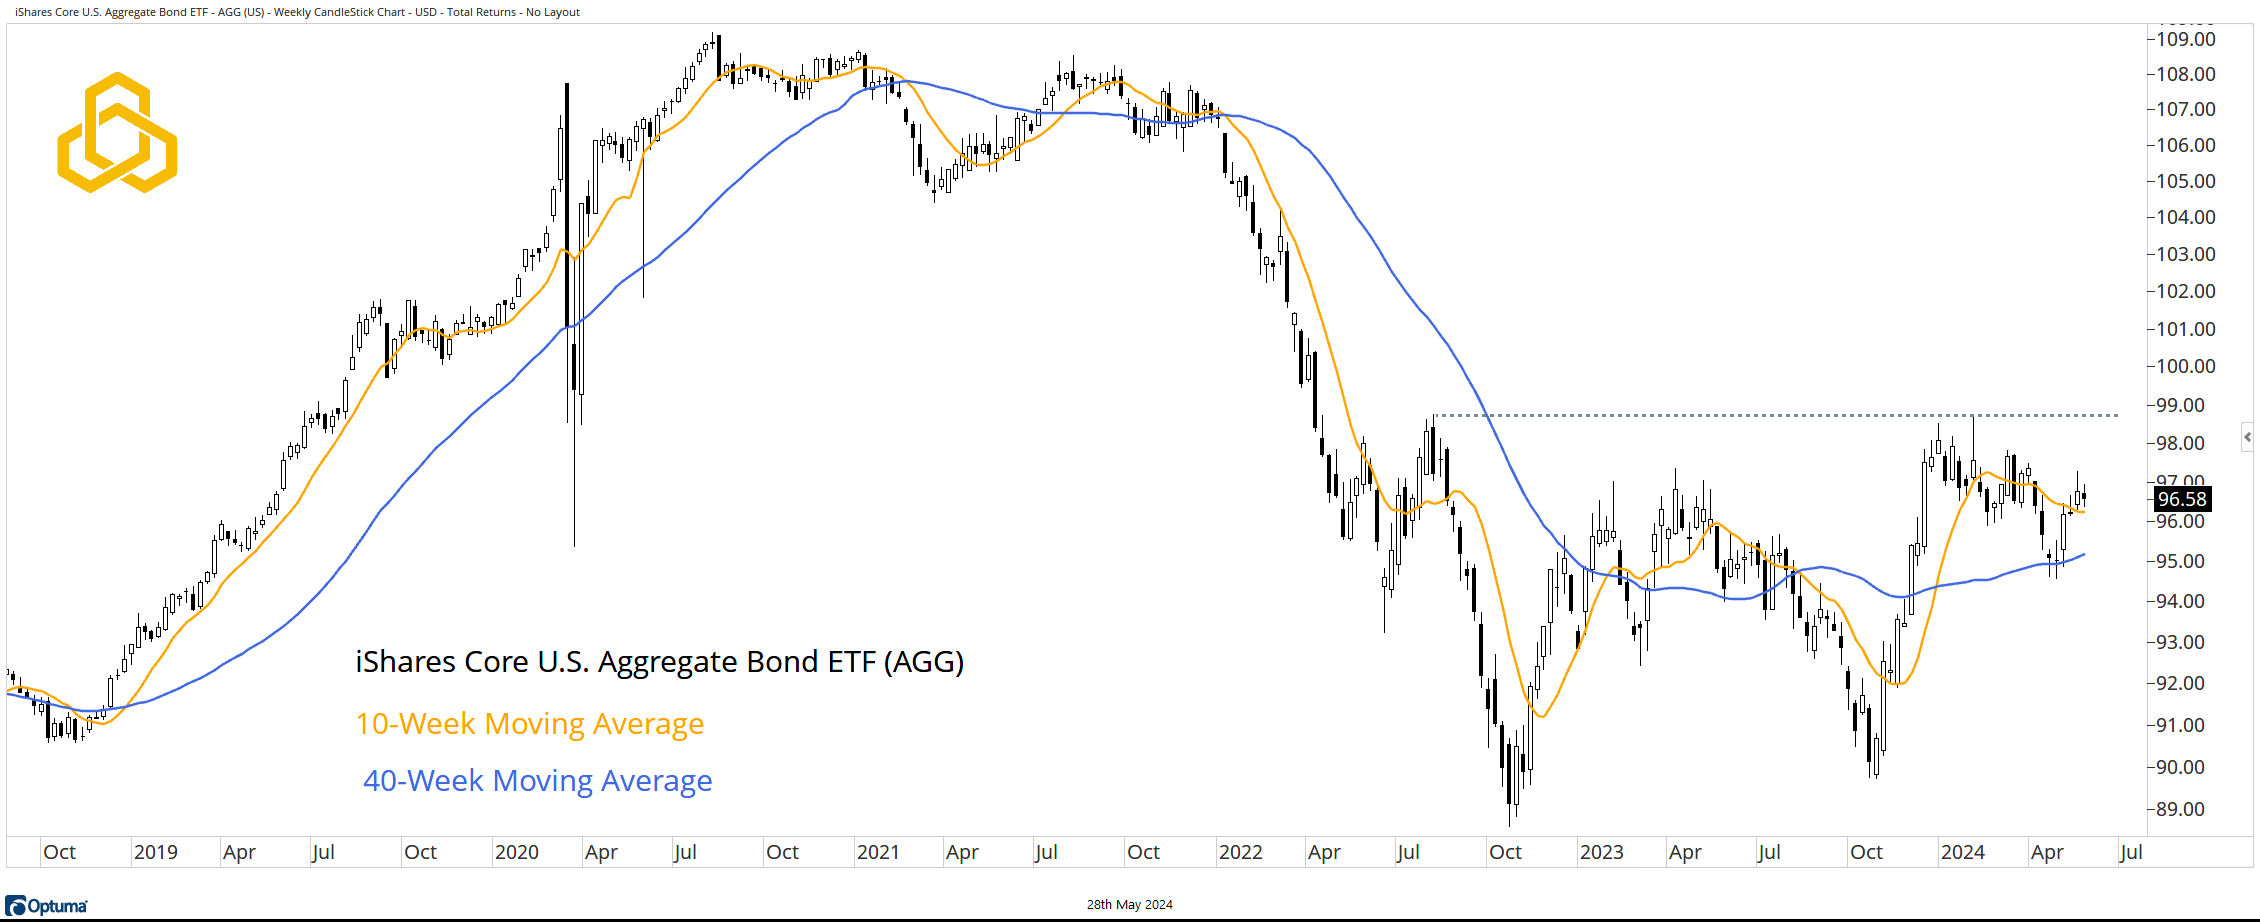
Bonds
The iShares Core U.S. Aggregate Bond ETF (AGG) has been building a base for nearly two years. Bullish price dynamics since the October 2023 low have parked the fund above the 10 and 40-week moving averages. A close above $99 would complete a bearish-to-bullish reversal. As our readers know, the stock/bond correlation is now positive, meaning rising bond prices are likely bullish for equities, lending confirmation to current trends.
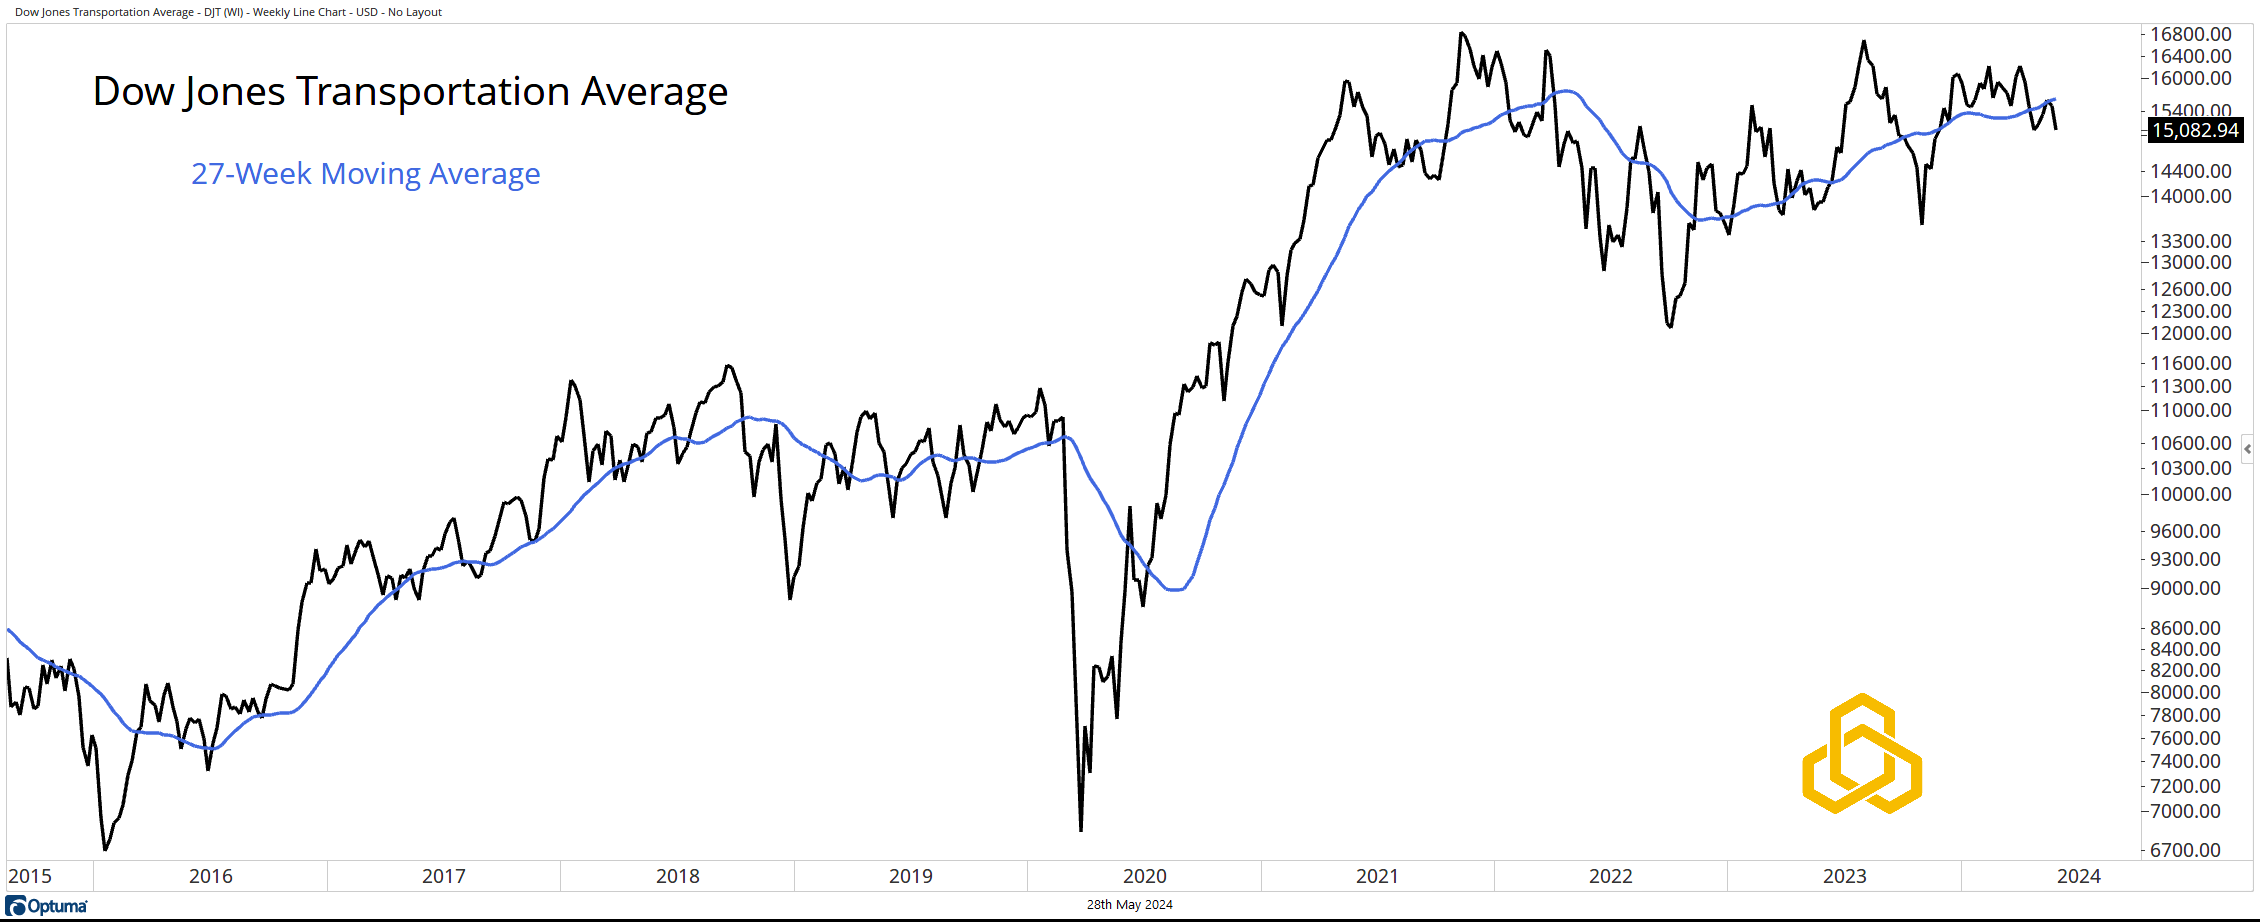
Transports
The Dow Jones Transportation Average is the one “flaw” we can see. Paying attention to the Transports is a simple concept that market analysts have used for more than a century. Some feel that this method of analysis has become outdated, but our work continues to support its efficacy, so we continue to pay attention.
The index has been in a sloppy consolidation for 2 ½ years and trades below a key moving average.
*All charts from Optuma as of the close of trading on May 24, 2024. Past performance does not guarantee future results.
Disclosure: This information is prepared for general information only and should not be considered as individual investment advice nor as a solicitation to buy or offer to sell any securities. This material does not constitute any representation as to the suitability or appropriateness of any investment advisory program or security. Please visit our FULL DISCLOSURE page.
PFM-330-20240528