

For weeks, months even, we have heard from the stock market bears that the breadth was weak. That there were in a concentration bubble. That there was only a select group of stocks pulling the market higher. Well, the past week of trading has incinerated that bear case.
The question is, will broadening participation, at the expense of the largest sector of the market, aid index performance. Said differently, can the S&P 500 sustain its uptrend if investors sell Technology to buy Small Caps, Financials, and/or Real Estate, for example?
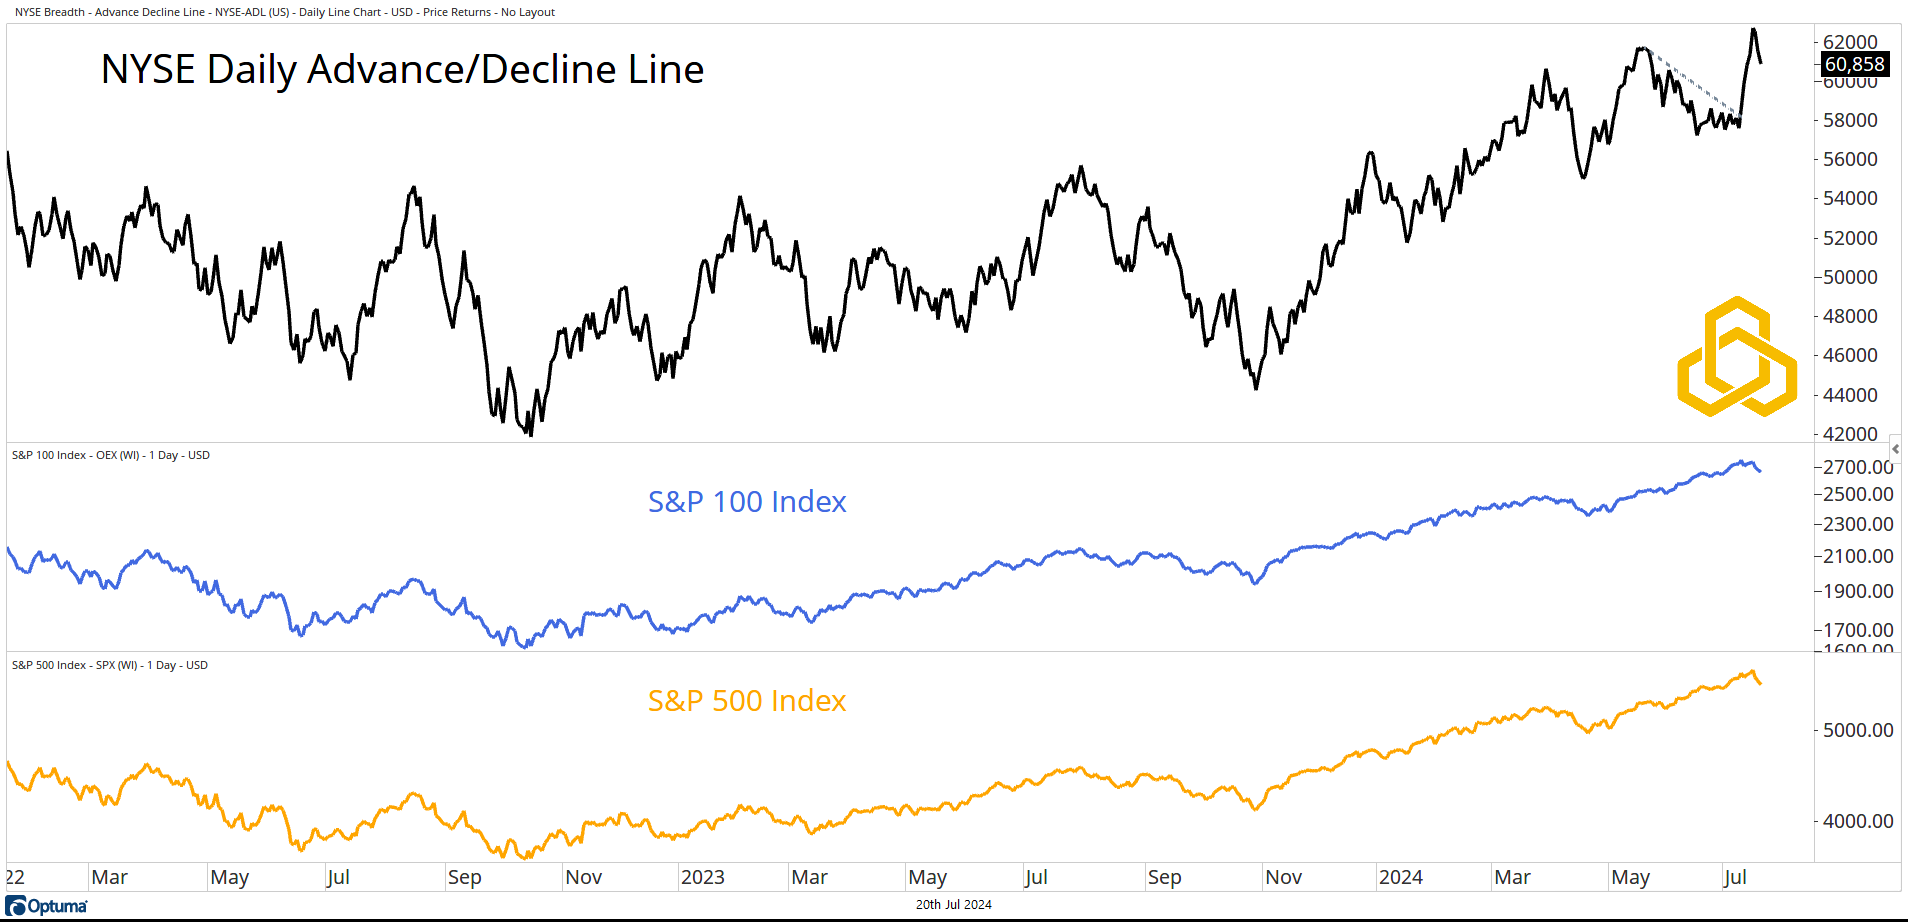
NYSE Advance/Decline Line
The NYSE Advance Decline Line traded to a new high recently, breaking a short-term downtrend, to confirm the strong bullish trend that has been in place for the S&P 100 and the S&P 500.
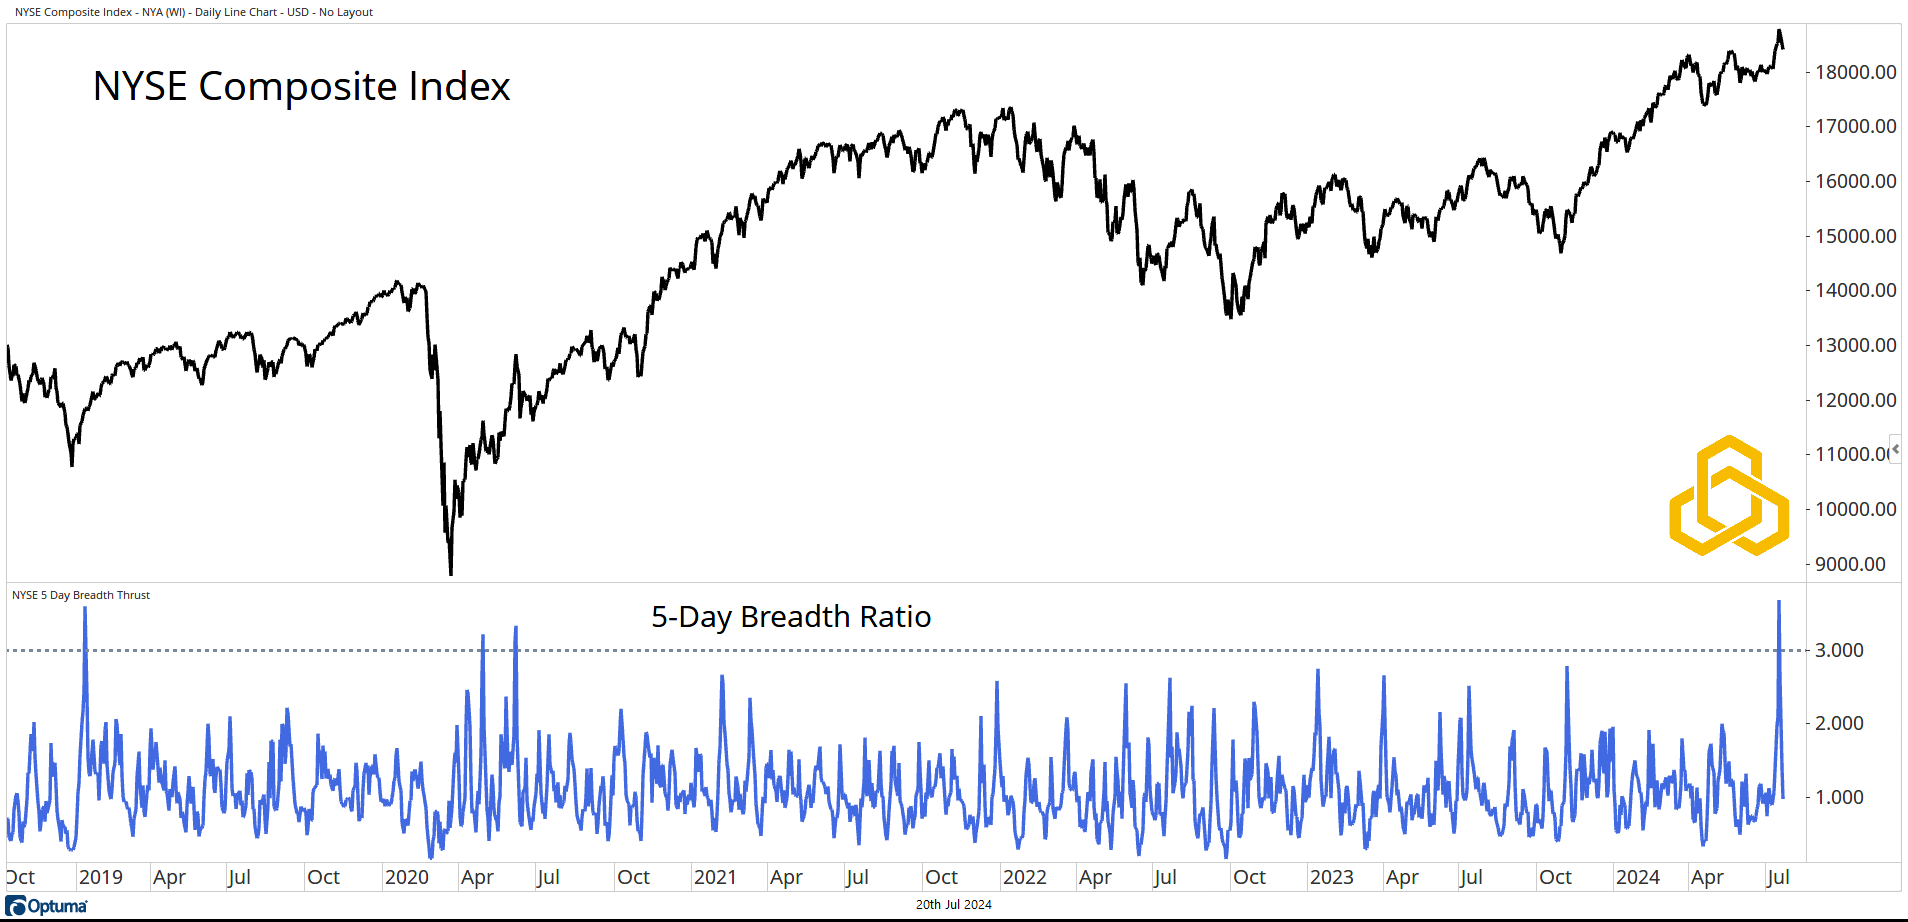
Five-Day Breadth Thrust
The 5-Day Breadth Ratio is a multiple of advancing stocks vs. declining stocks. A ratio of three simply means that the five-day sum of advancers on the NYSE is three times the five-day sum of decliners. That level is not seen often.
When it is seen, it is usually at the start of a new bull market (1Q2019, 2Q2020). Last week gave us this level of breadth expansion while the NYSE Composite Index was trading at an all-time high. Bulls are excited, bears will tell you it is a “blow-off top.”
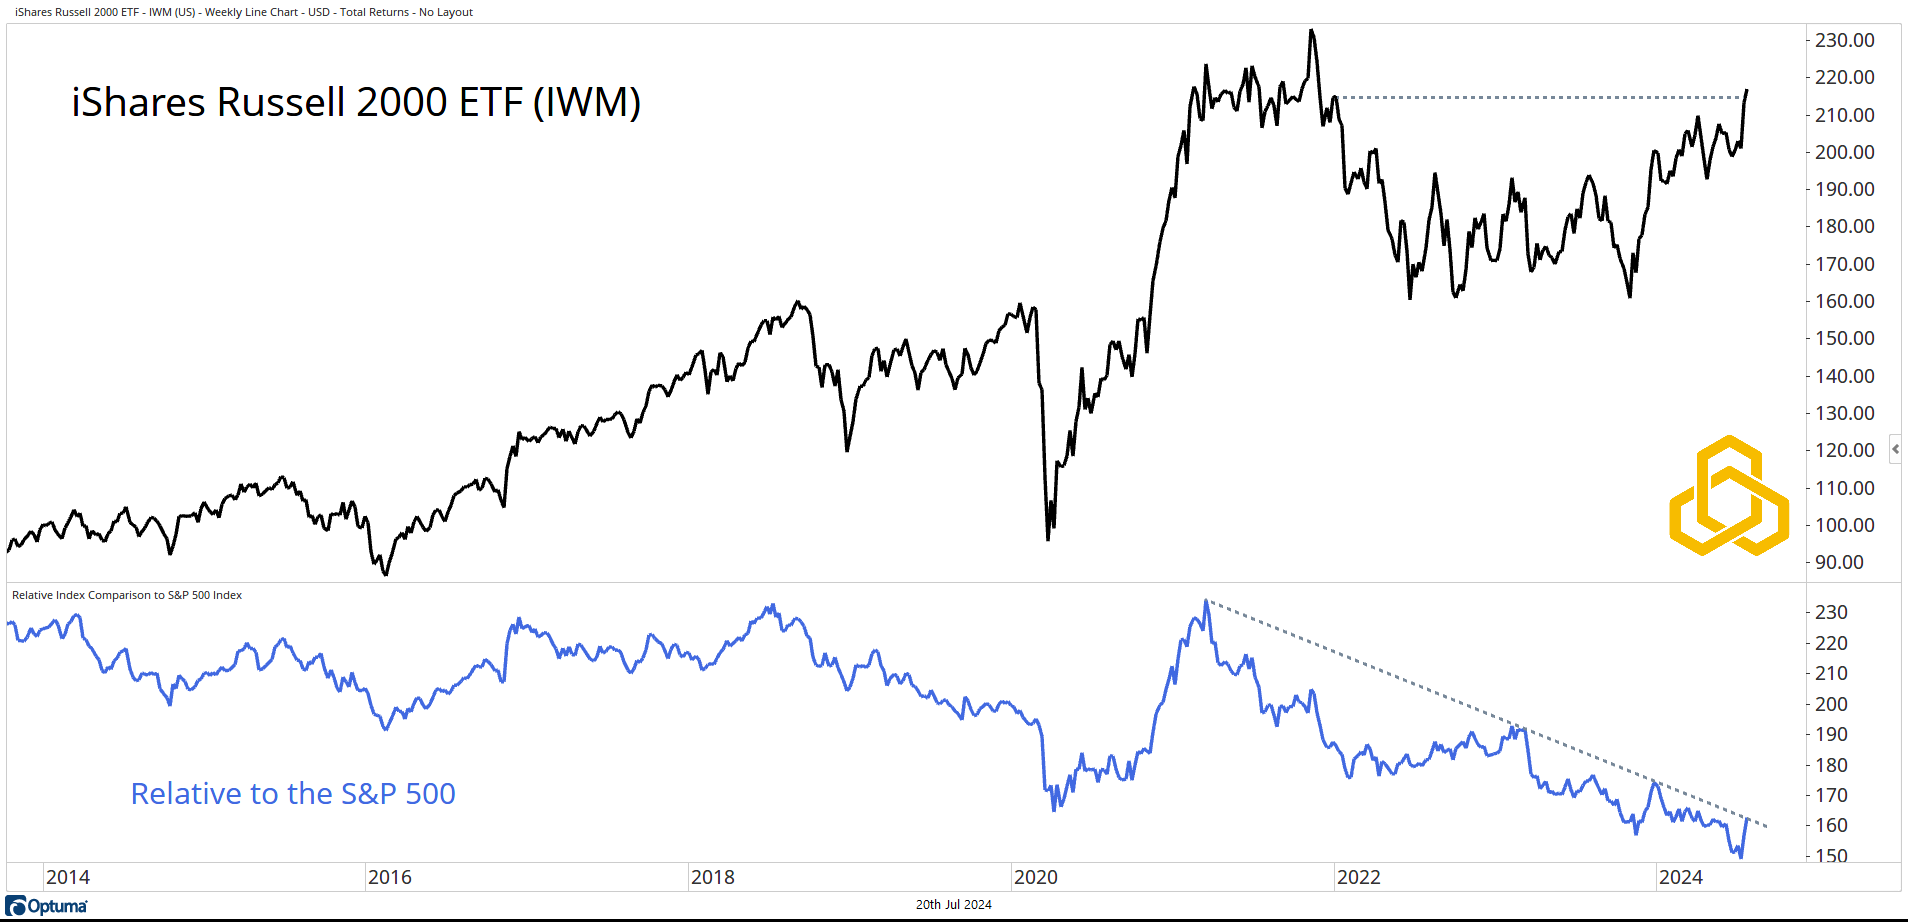
Russell 2000
Even the beleaguered Russell 2000, home to the smallest and often lowest quality companies in the market, joined the rally party. The group has rallied nearly 35% from the October 2023 lows to put prior highs in its sights. The last time the smalls were at current levels was December 2021. The fact that Small Caps are participating is a welcome breadth development.
But, before the rotation crowd crowns a new king, note that IWM is still in a downtrend relative to the S&P 500. This is a trend that has been in place since March 2021 so forgive me if I demand a higher burden of proof before agreeing with this crowd.
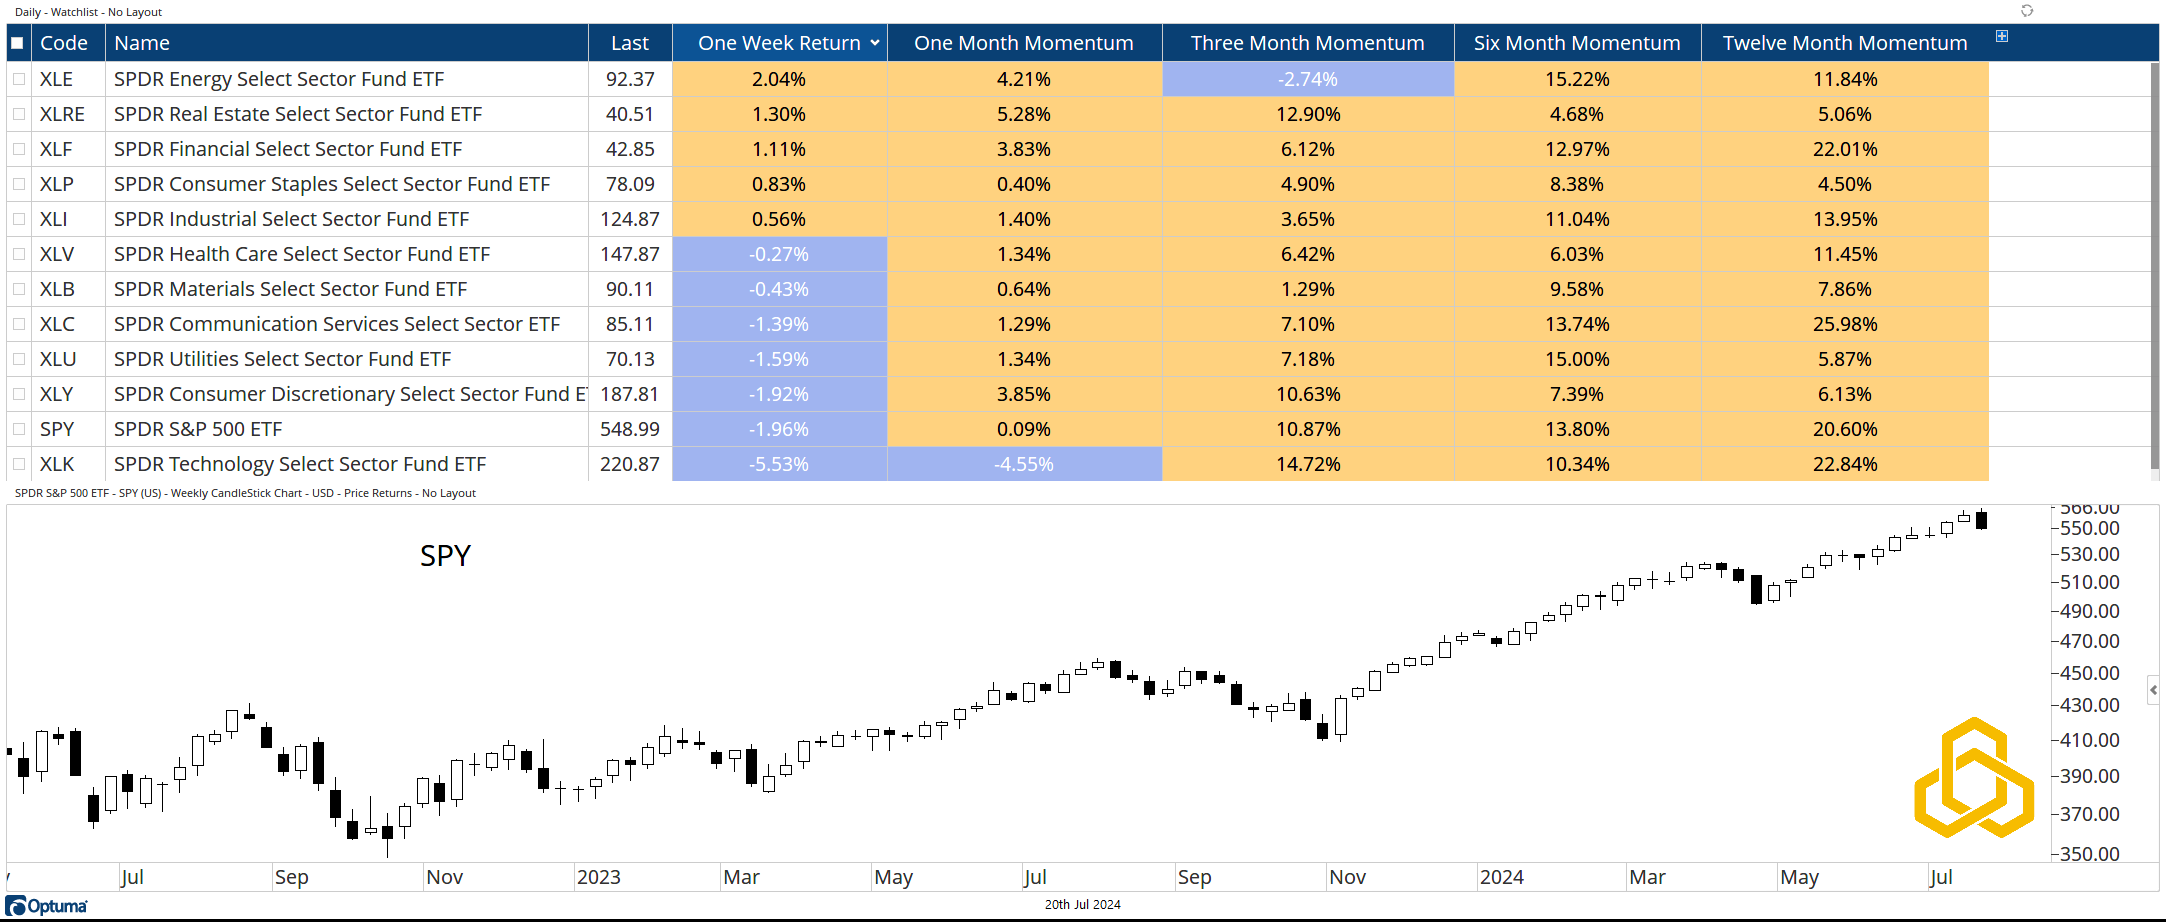
Sector Performance
Over the past week, only one group underperformed the S&P 500. That group was Technology. Despite the other ten sectors leading the charge, the S&P 500 still closed lower on the week by nearly 2% (see the last candle filled in black).
Bent, Not Broken
Despite the drawdown in the Technology Sector last week, the trend remains bullish above the rising 50-day (gold) and 200-day (blue) moving averages. This is key as Technology is the largest weight in the S&P 500.
The darling of the sector, Semiconductors, is testing the 50-day while remaining well above the 200-day.
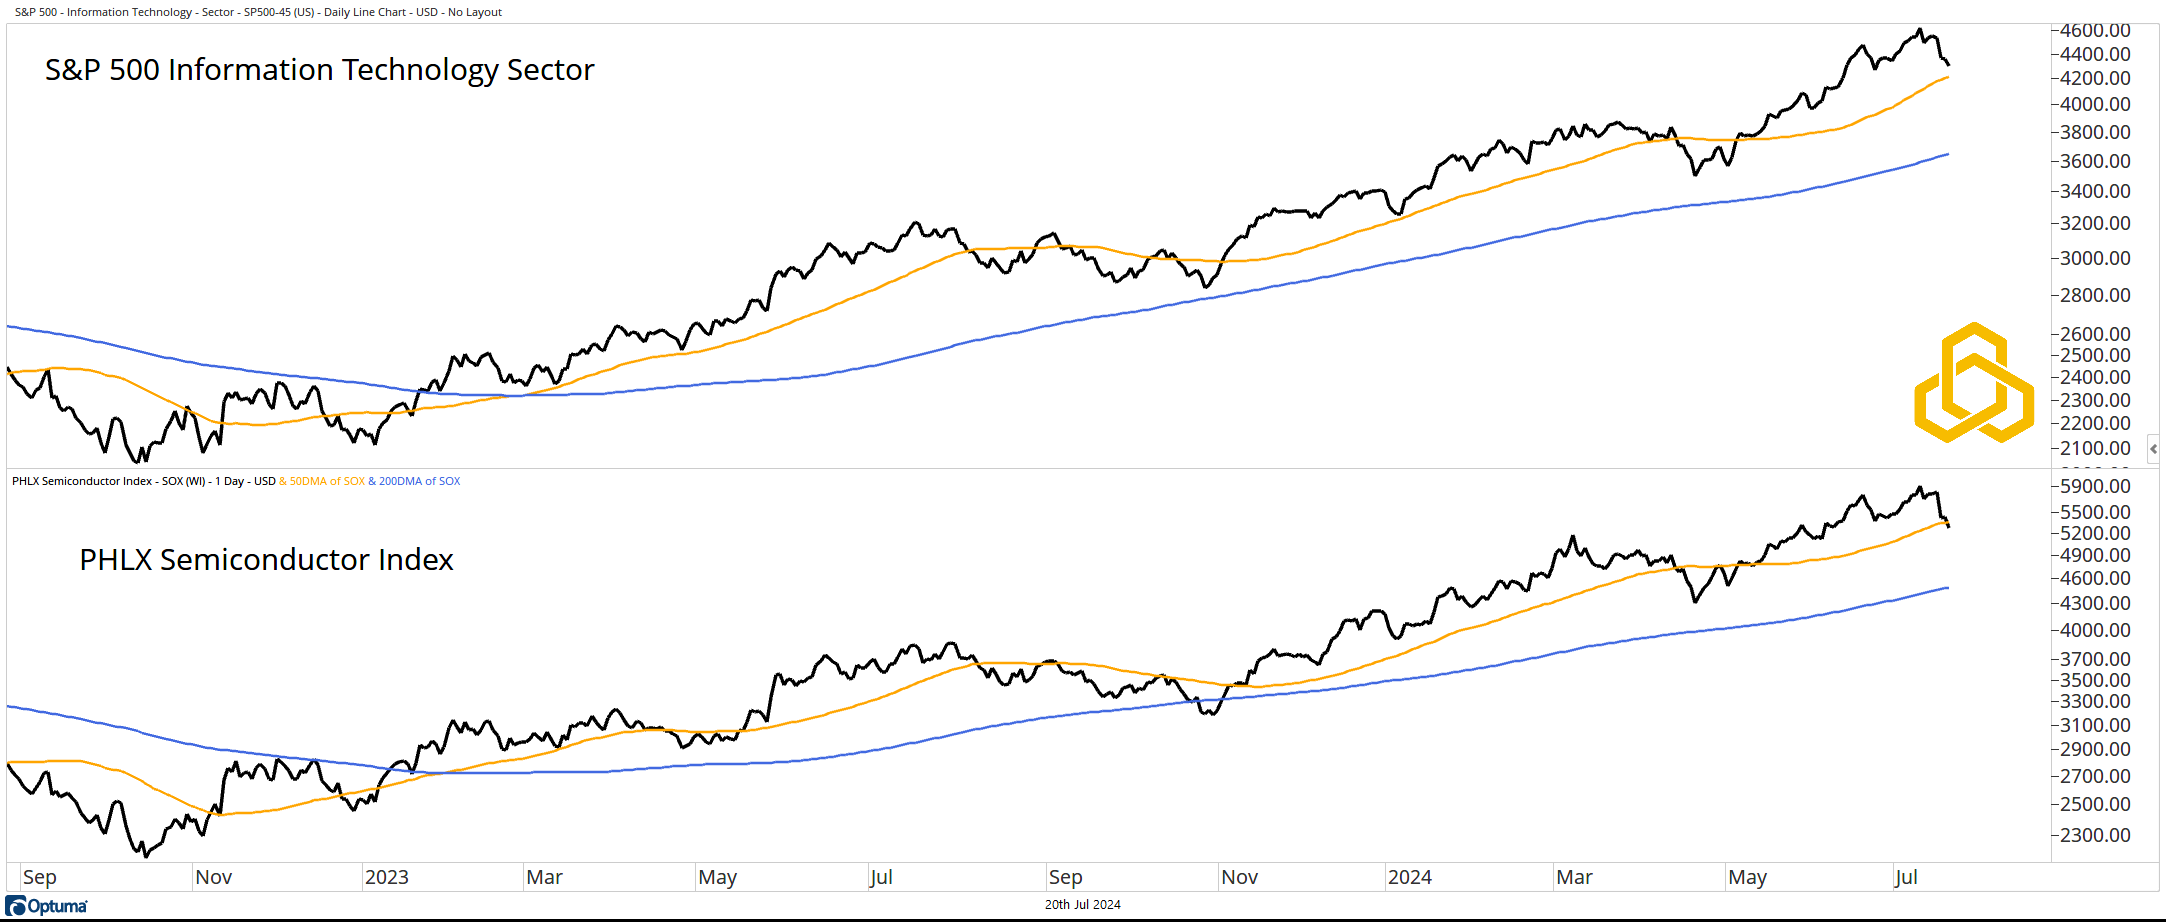
The key to a sustained market rally is for participation to remain broad without material damage to these two charts. As of now they are bent, not broken.
*All charts from Optuma as of the close of trading on July 19, 2024. Past performance does not guarantee future results.
Disclosure: This information is prepared for general information only and should not be considered as individual investment advice nor as a solicitation to buy or offer to sell any securities. This material does not constitute any representation as to the suitability or appropriateness of any investment advisory program or security. Please visit our FULL DISCLOSURE page.
PFM-346-20240722