

A Santa Claus rally refers to the sustained increases found in the stock market during the last five trading days of December through the first two trading days of January. Since 1950, during this seven-day trading window, the S&P 500 has gained an average of 1.3% and been positive 79% of the time.
Yale Hirsch, the founder of the annual Stock Trader's Almanac, coined the "Santa Claus Rally" in 1972 for the likely market performance during the last five trading days of December and the first two trading days of January. Many people wrongly believe that the entire month of December is open to the SCR, however, there is a strict window of time when it is open (as stated above). The key is to understand that the market is supposed to go up during the SCR period. It is only when the market fails to rally over this seven-day stretch that investors should take notice.
S&P 500
Let’s be clear, despite a second consecutive down week, the S&P 500 remains in an uptrend. The index sits firmly above a steadily rising 60-week moving average. Based on the price data, there is not a lot of cause for major concern.
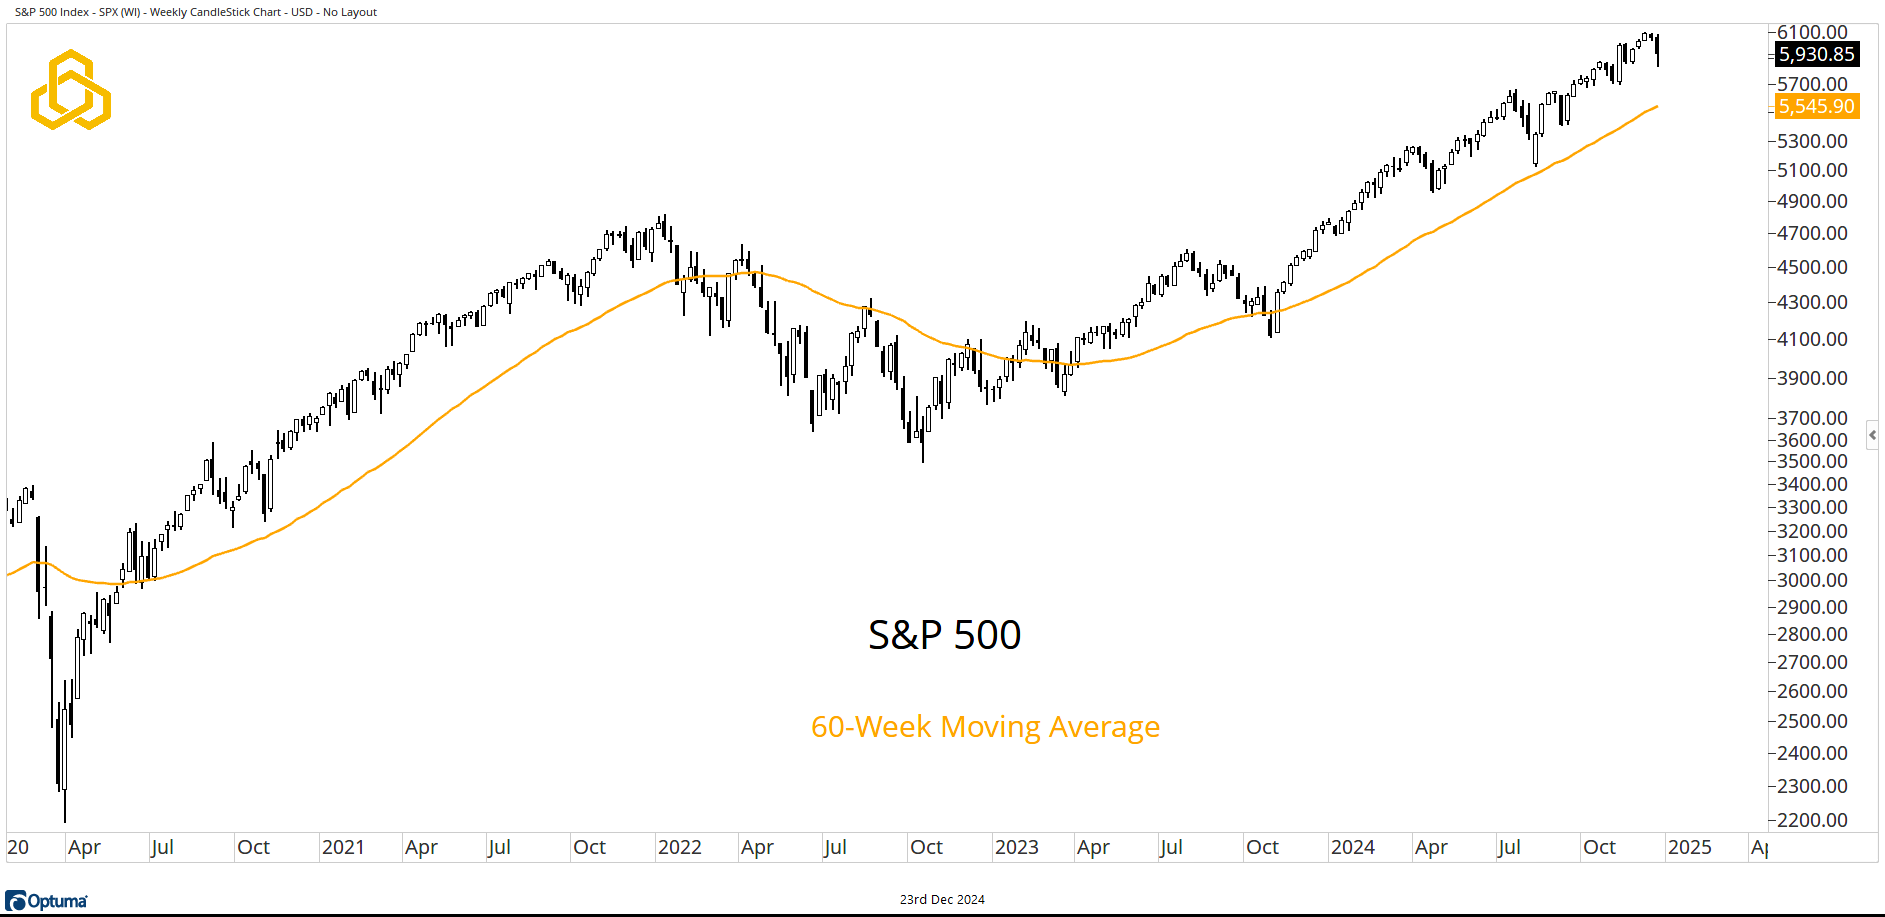
Source: Optuma
NYSE Advance/ Decline Line
If we wanted to look for weakness in the health of the market’s trend, we would start with breadth. In a healthy bull market, we expect to see more stocks rising than falling.
The NYSE Advance/Decline Line has come under pressure over the past three weeks, pushing the one-year stochastic below 80% for the first time since July.
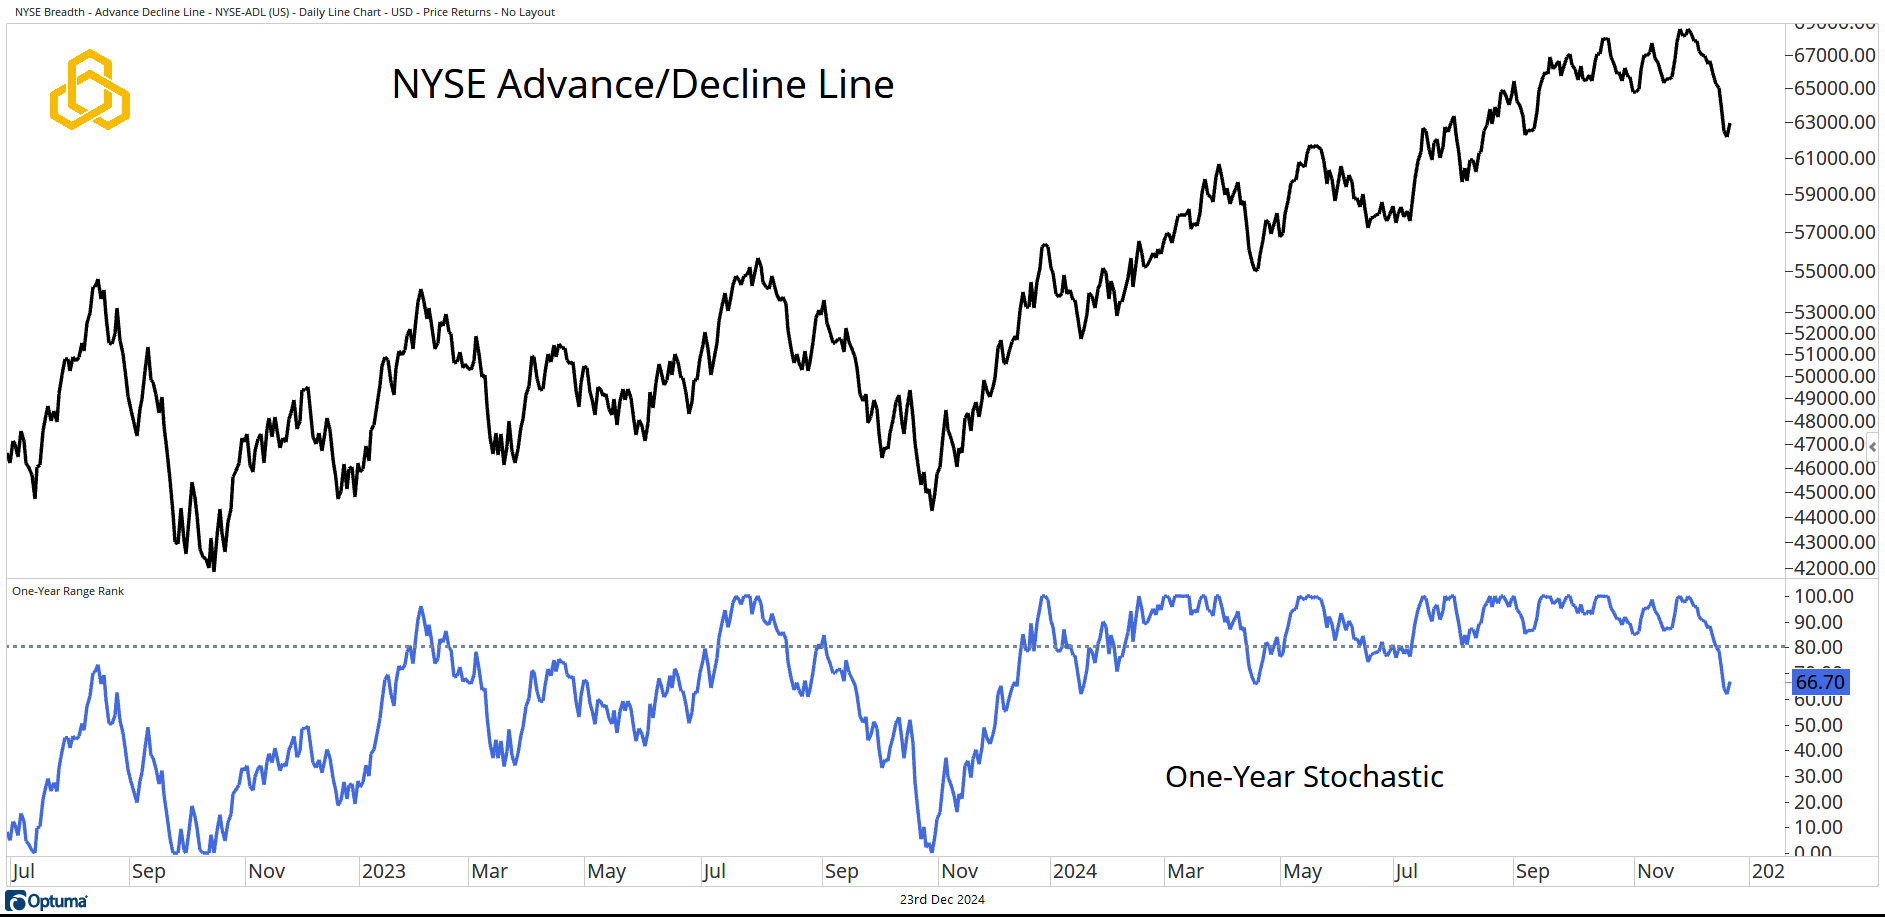
Source: Optuma
NYSE New Highs and New Lows
While the A/D Line comes under pressure, we are also seeing an increase in the percentage of stocks on the NYSE making new 52-week lows and a decrease in the percentage of stocks making new 52-week highs.
Both dynamics are a reversal from what we have seen for much of 2024.
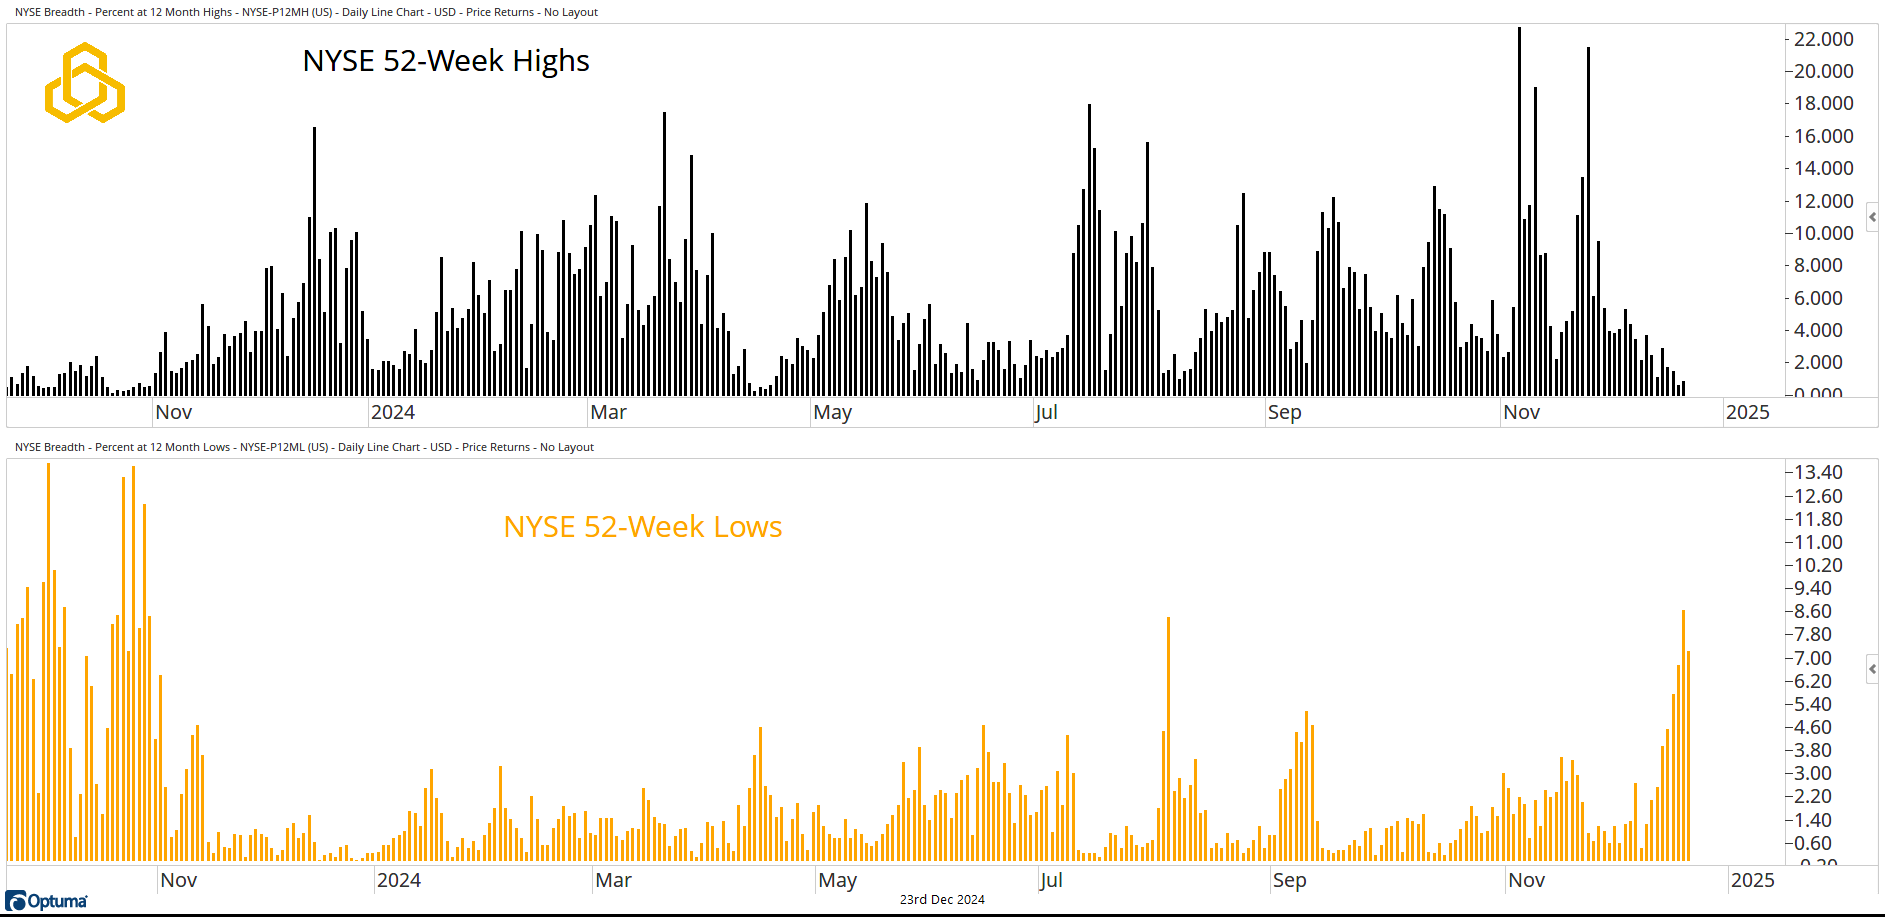
Source: Optuma
Dow Jones Transportation Average
From an intermarket perspective, we can’t help but be disappointed in the fact that the Dow Jones Transportation Average closed last week below the 27-week moving average. The average was unable to build ion the break above 17,000 and finds itself back in the range that marked traded from November 2021 until November 2024.
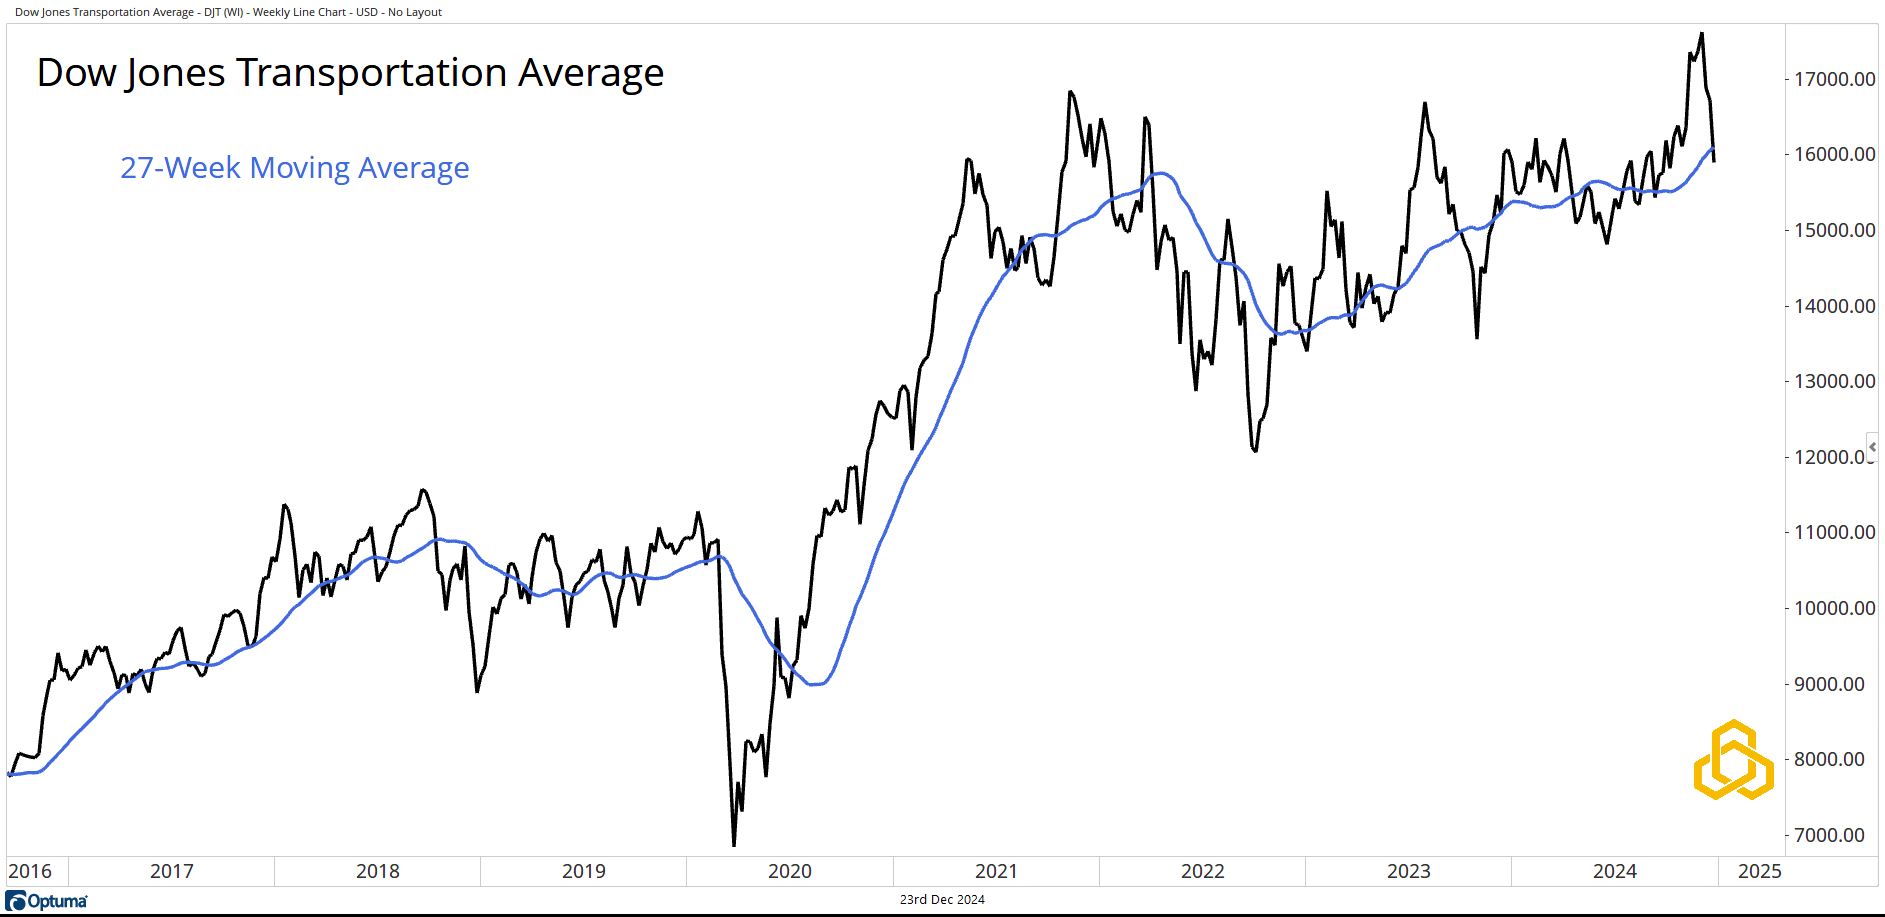
Source: Optuma
Investment Grade Corporate Bonds
The iShares iBoxx Investment Grade Corporate Bond ETF (LQD) has also come under pressure of late and has close below the 27-week moving average.
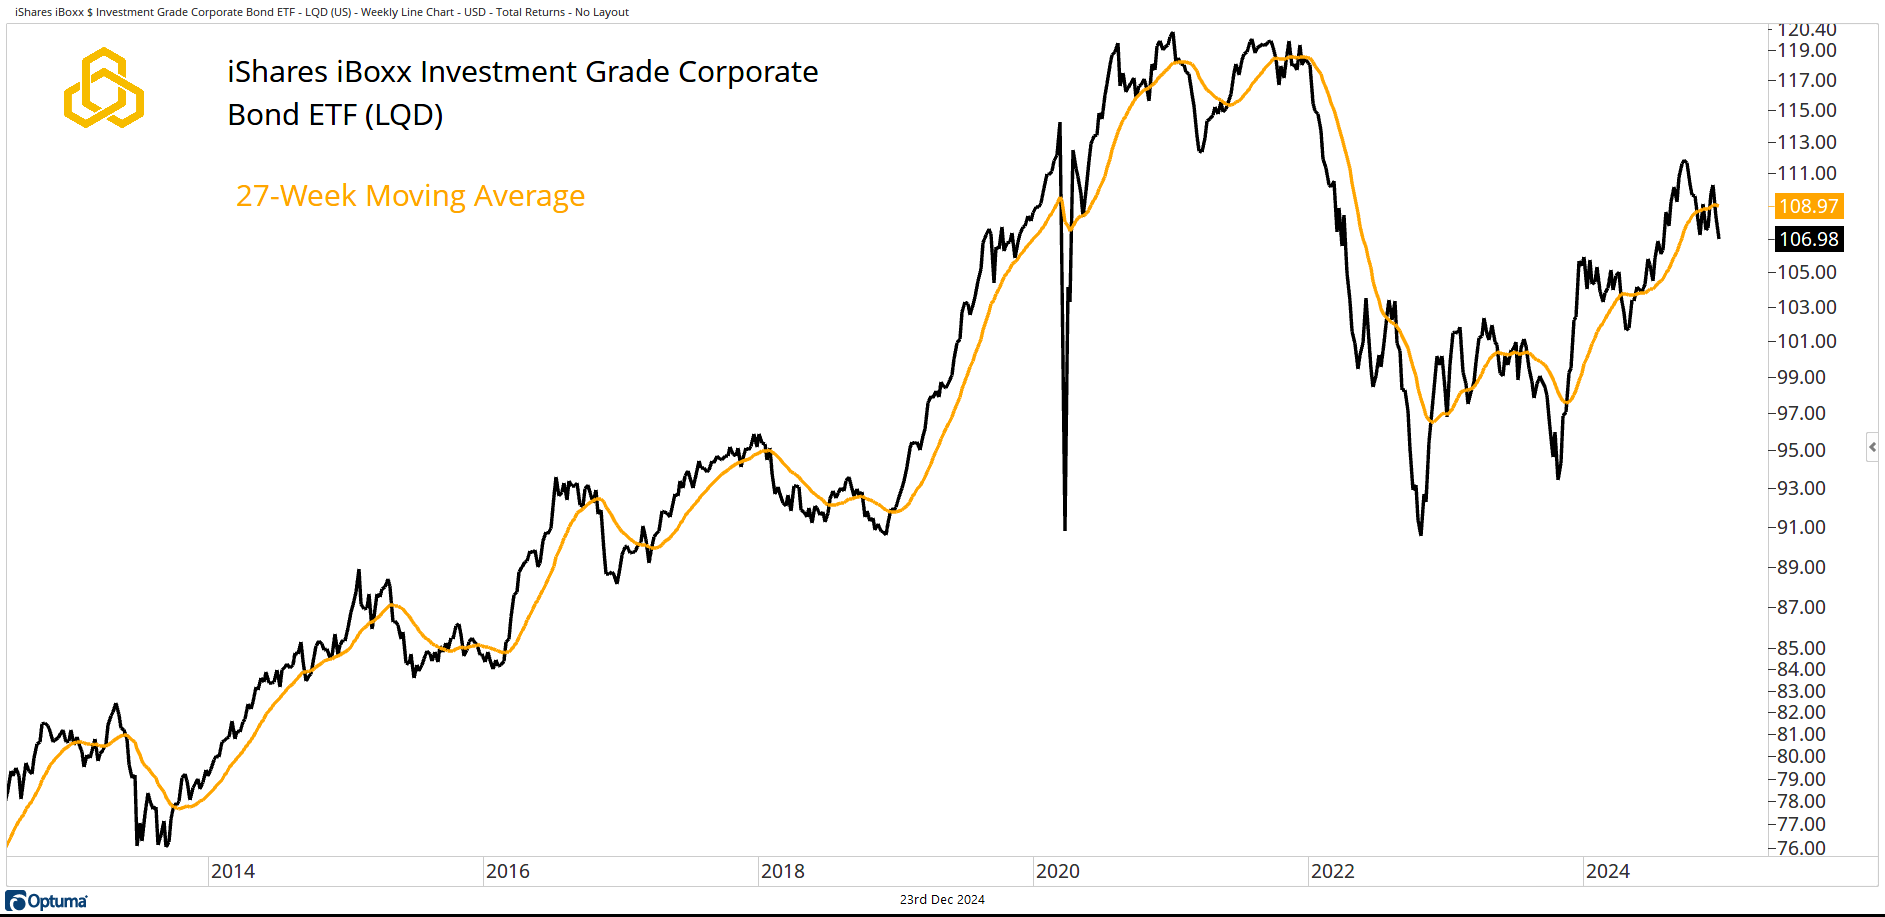
Source: Optuma
This note is not an attempt to be a “Grinch” leading up to the holidays, it is simply an attempt to be mindful of the old Wall Street maxim that relates to the Santa Claus Rally window: “If Santa Claus should fail to call, bears may come to Broad and Wall.”
The entire team at Potomac wishes all of you a happy and healthy holiday season doing what you love with the people who mean the most to you.
Disclosure: This information is prepared for general information only and should not be considered as individual investment advice nor as a solicitation to buy or offer to sell any securities. This material does not constitute any representation as to the suitability or appropriateness of any investment advisory program or security. Please visit our FULL DISCLOSURE page.
PFM-379-20241223