

While much of our writing has had a bullish tilt, we are open to the idea that there is a bear case to be made. I am not going to go into the usual “seasonality” argument, as it is widely understood that September is a rough month for equities. Rather, I will focus on market-based trends that bears can legitimately use to make a bearish argument.
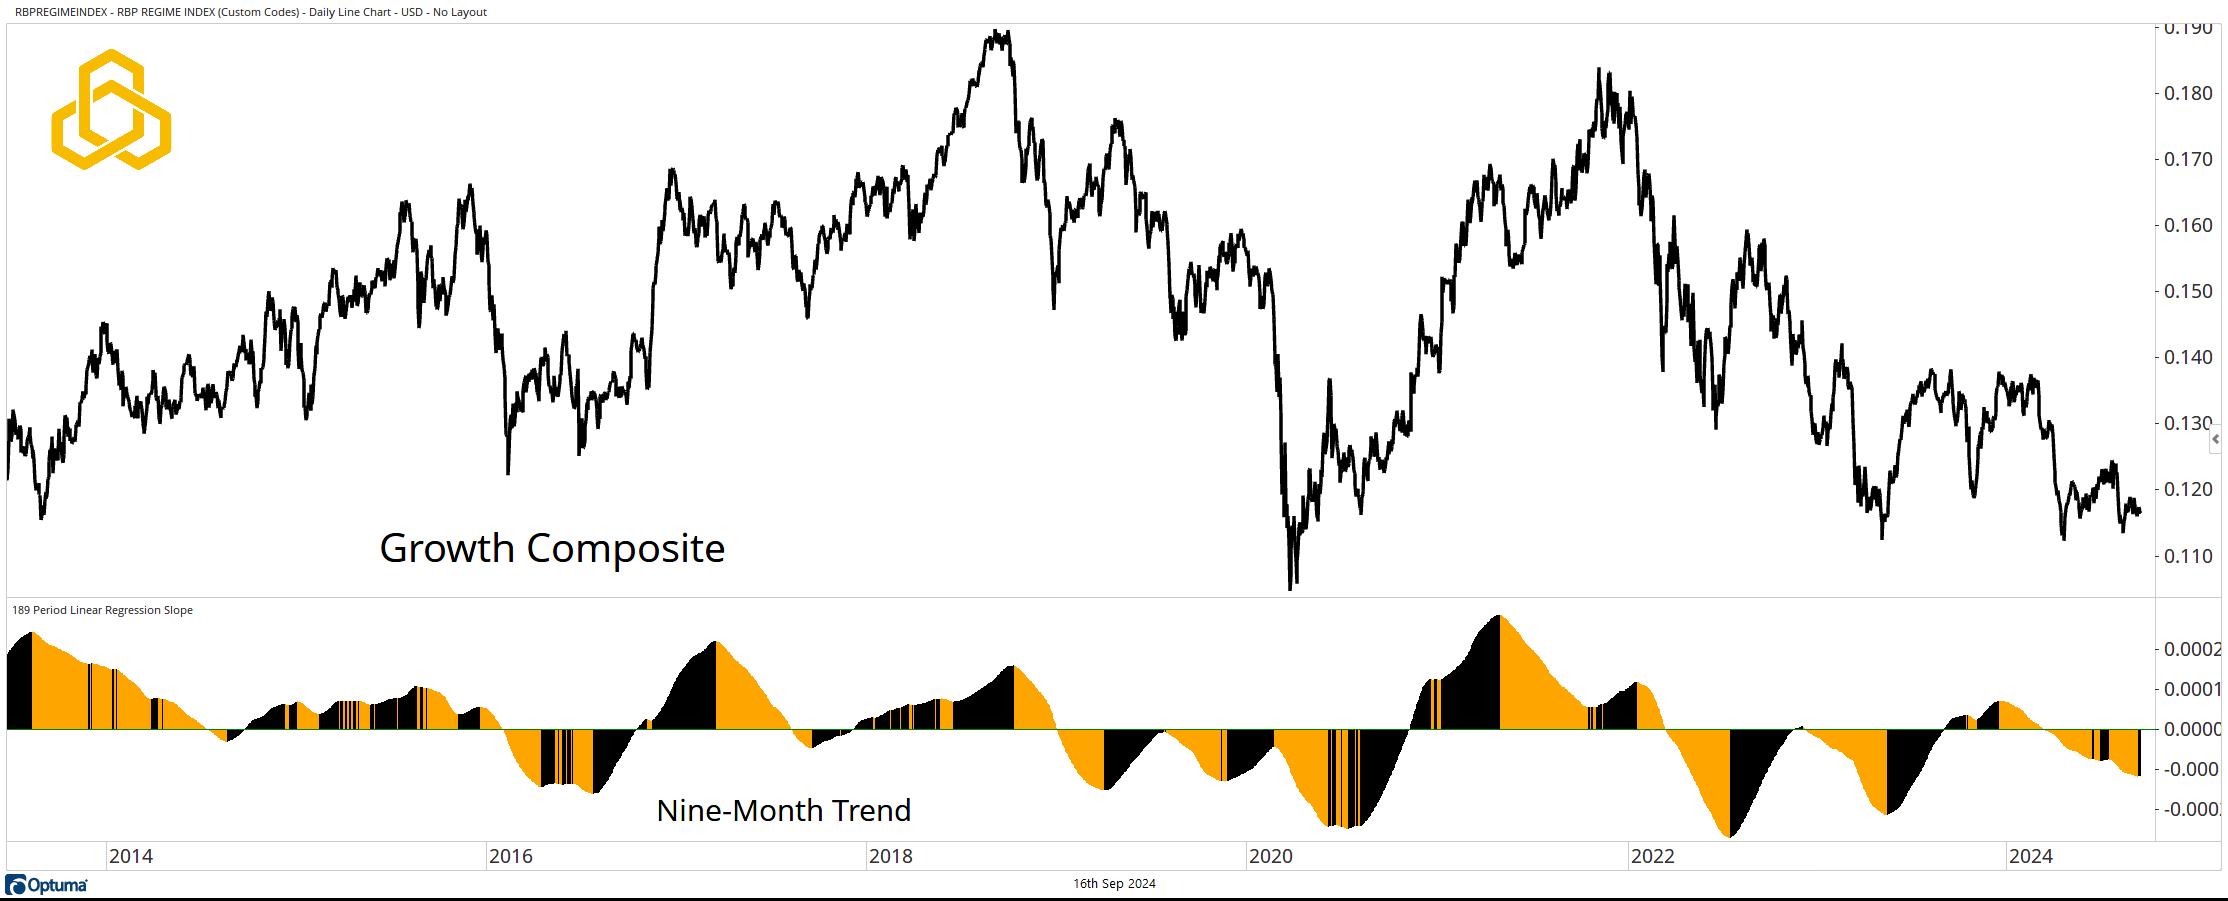
Growth Composite
The Growth Composite looks at intermarket trends for assets that are sensitive to economic growth. These trends track across equities, credit, and commodities, and are market-based. The nine-month trend of the composite has been negative since March 2024.
For those wondering why the Federal Reserve is likely to cut rates with the S&P 500 near an all-time high, it is because economic growth appears to be slowing.
Source: Optuma
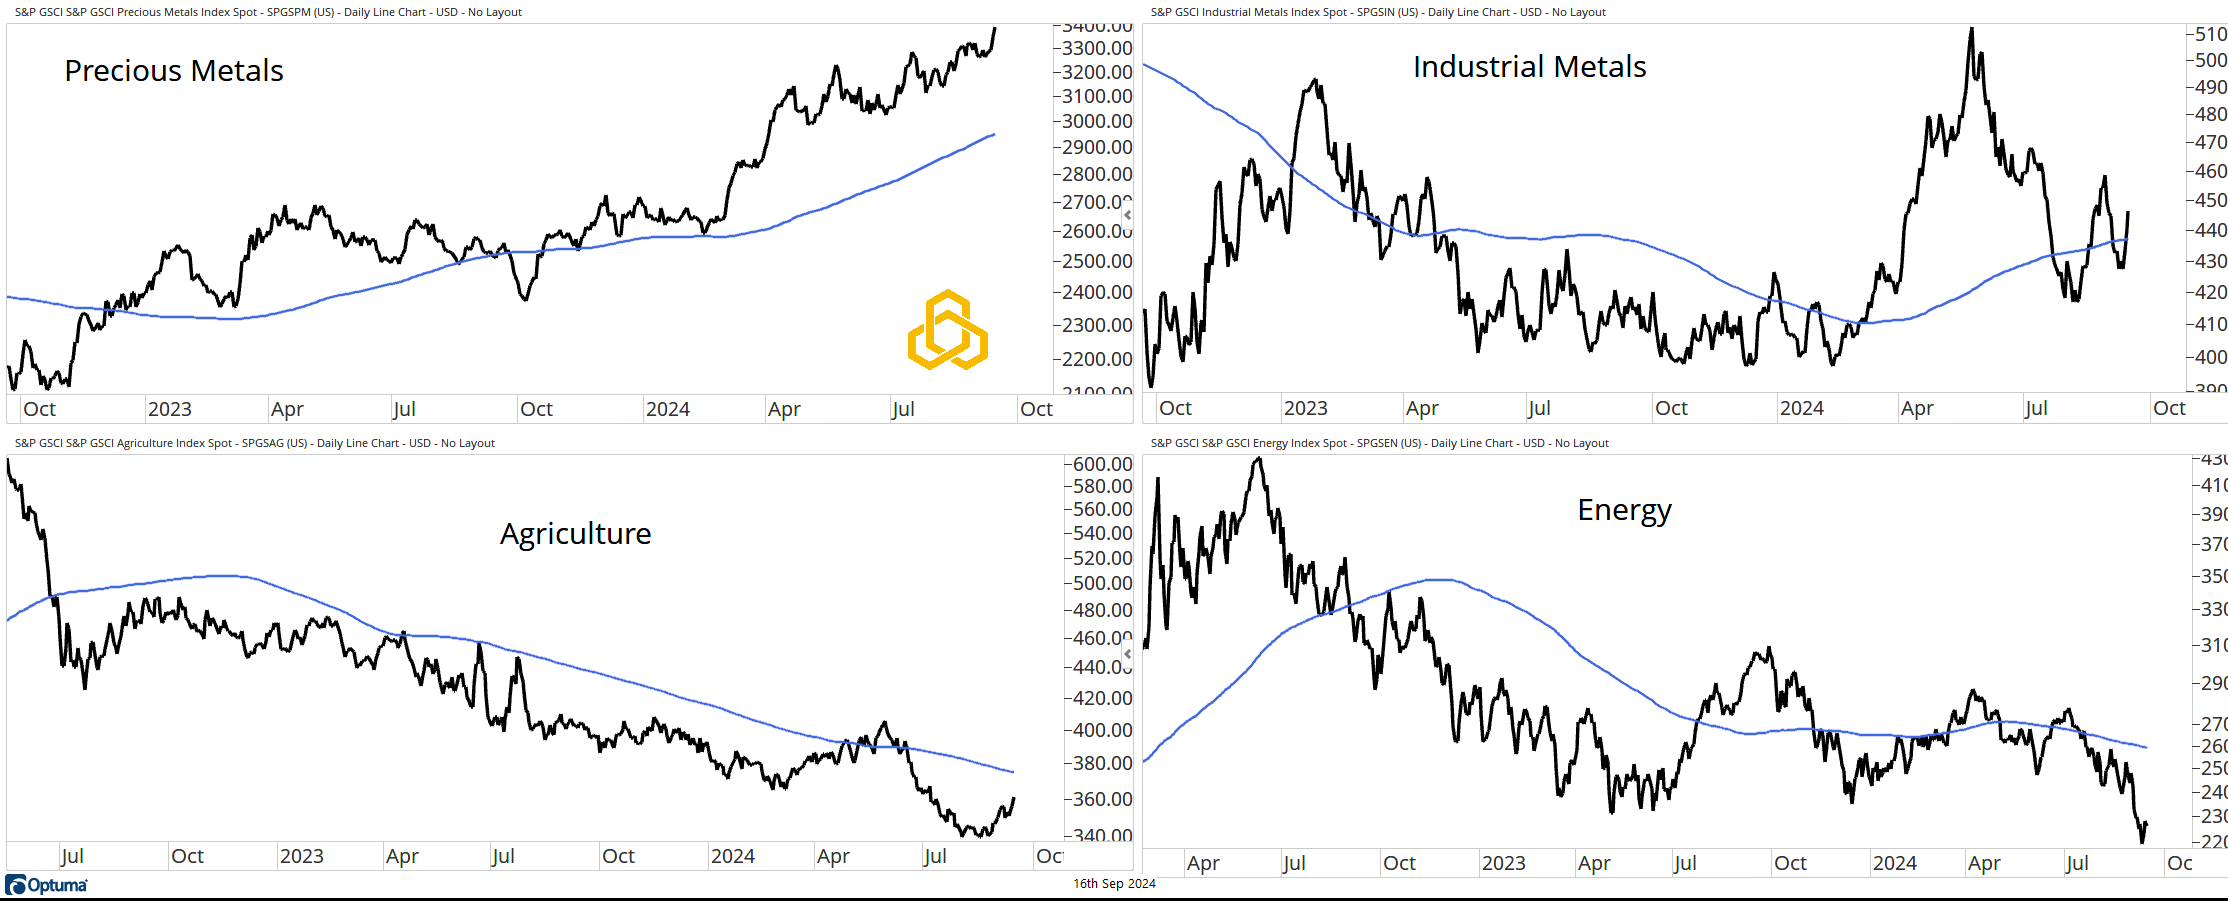
The Commodity Complex
Next, I would highlight that the biggest, brightest shining star in the commodity complex has been Precious Metals, trading at local highs above the 200-day moving average.
At the same time, I would point out that the economically sensitive parts of the complex are not performing as well. Agriculture and Energy seem to indicate that inflation has moderated and may continue to do so, giving the Federal Reserve “air cover” for a rate cut.
Source: Optuma
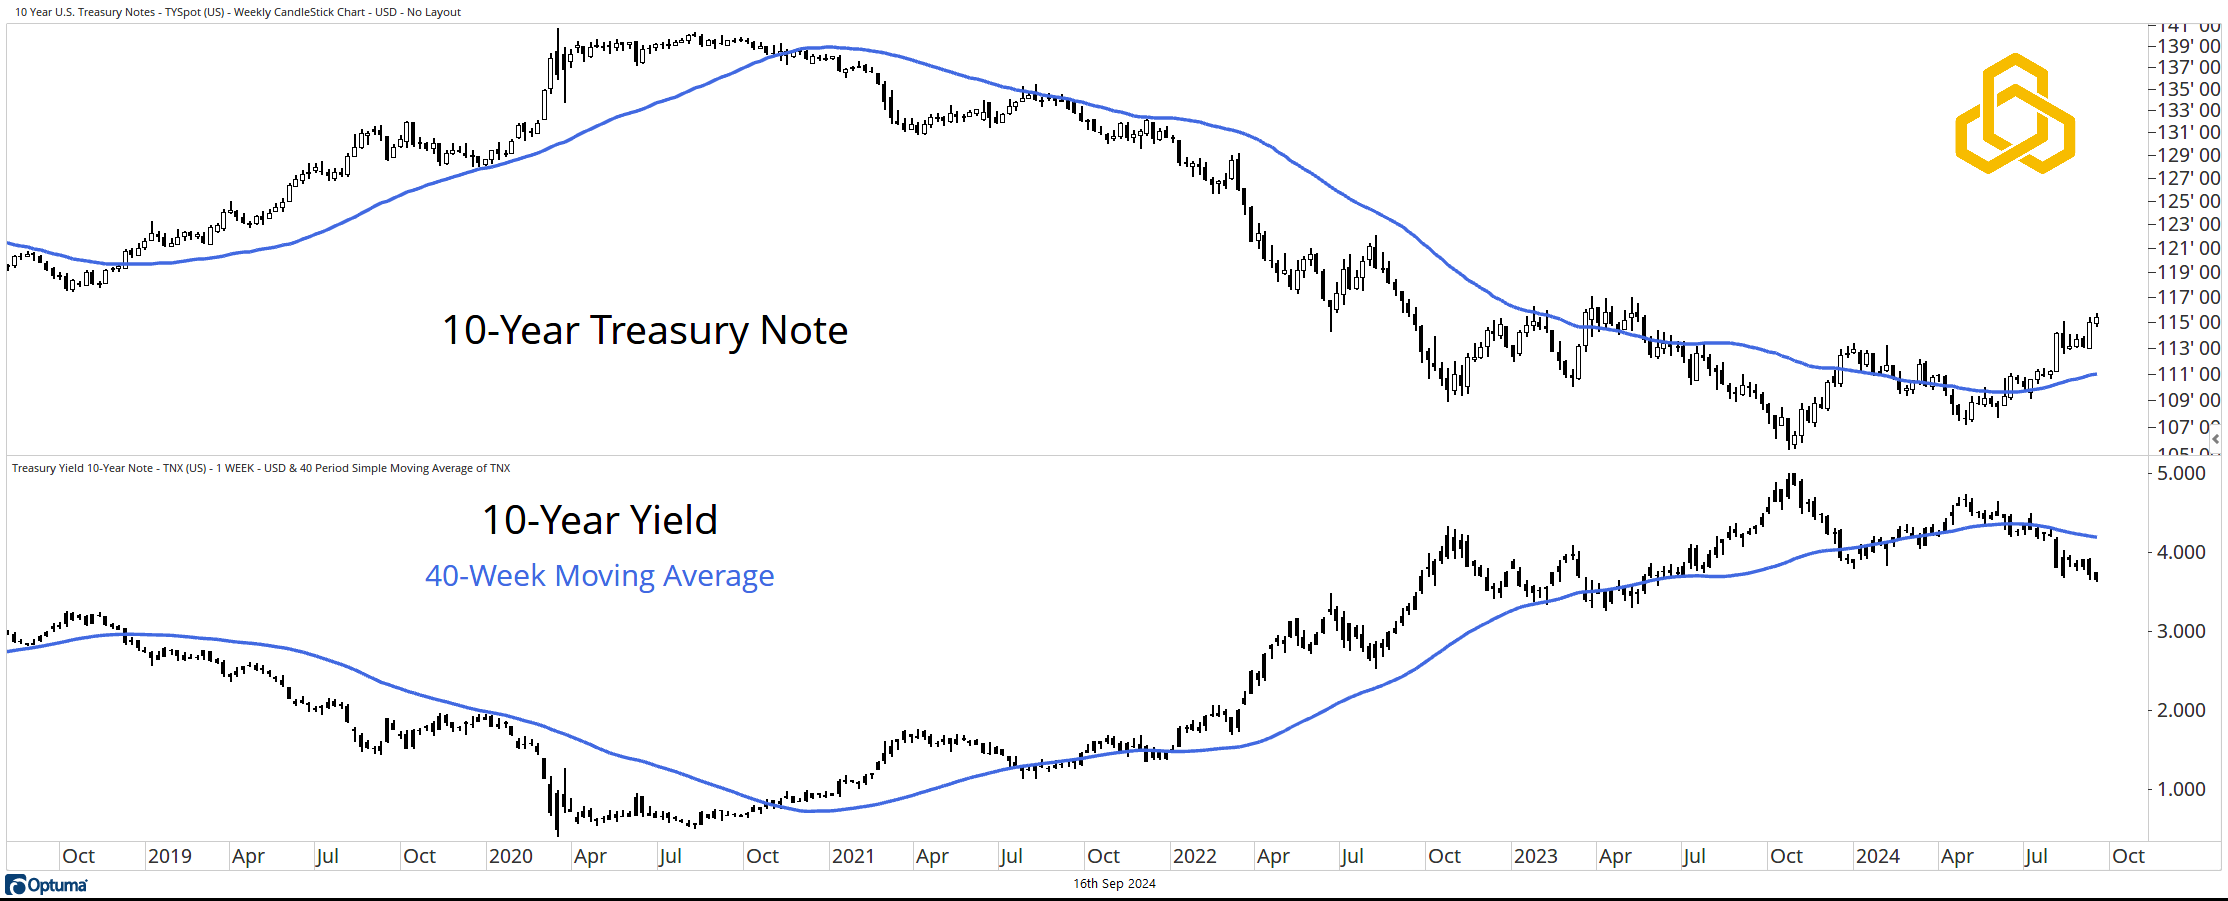
The 10-Year Treasury Note
With inflation now moderating, I would point out that the 10-Year Note appears to be in the process of completing a bearish-to-bullish reversal above a now rising 40-week moving average. The 10-Year Yield did the opposite, as we would expect, moving lower and trading below its moving average.
Source: Optuma
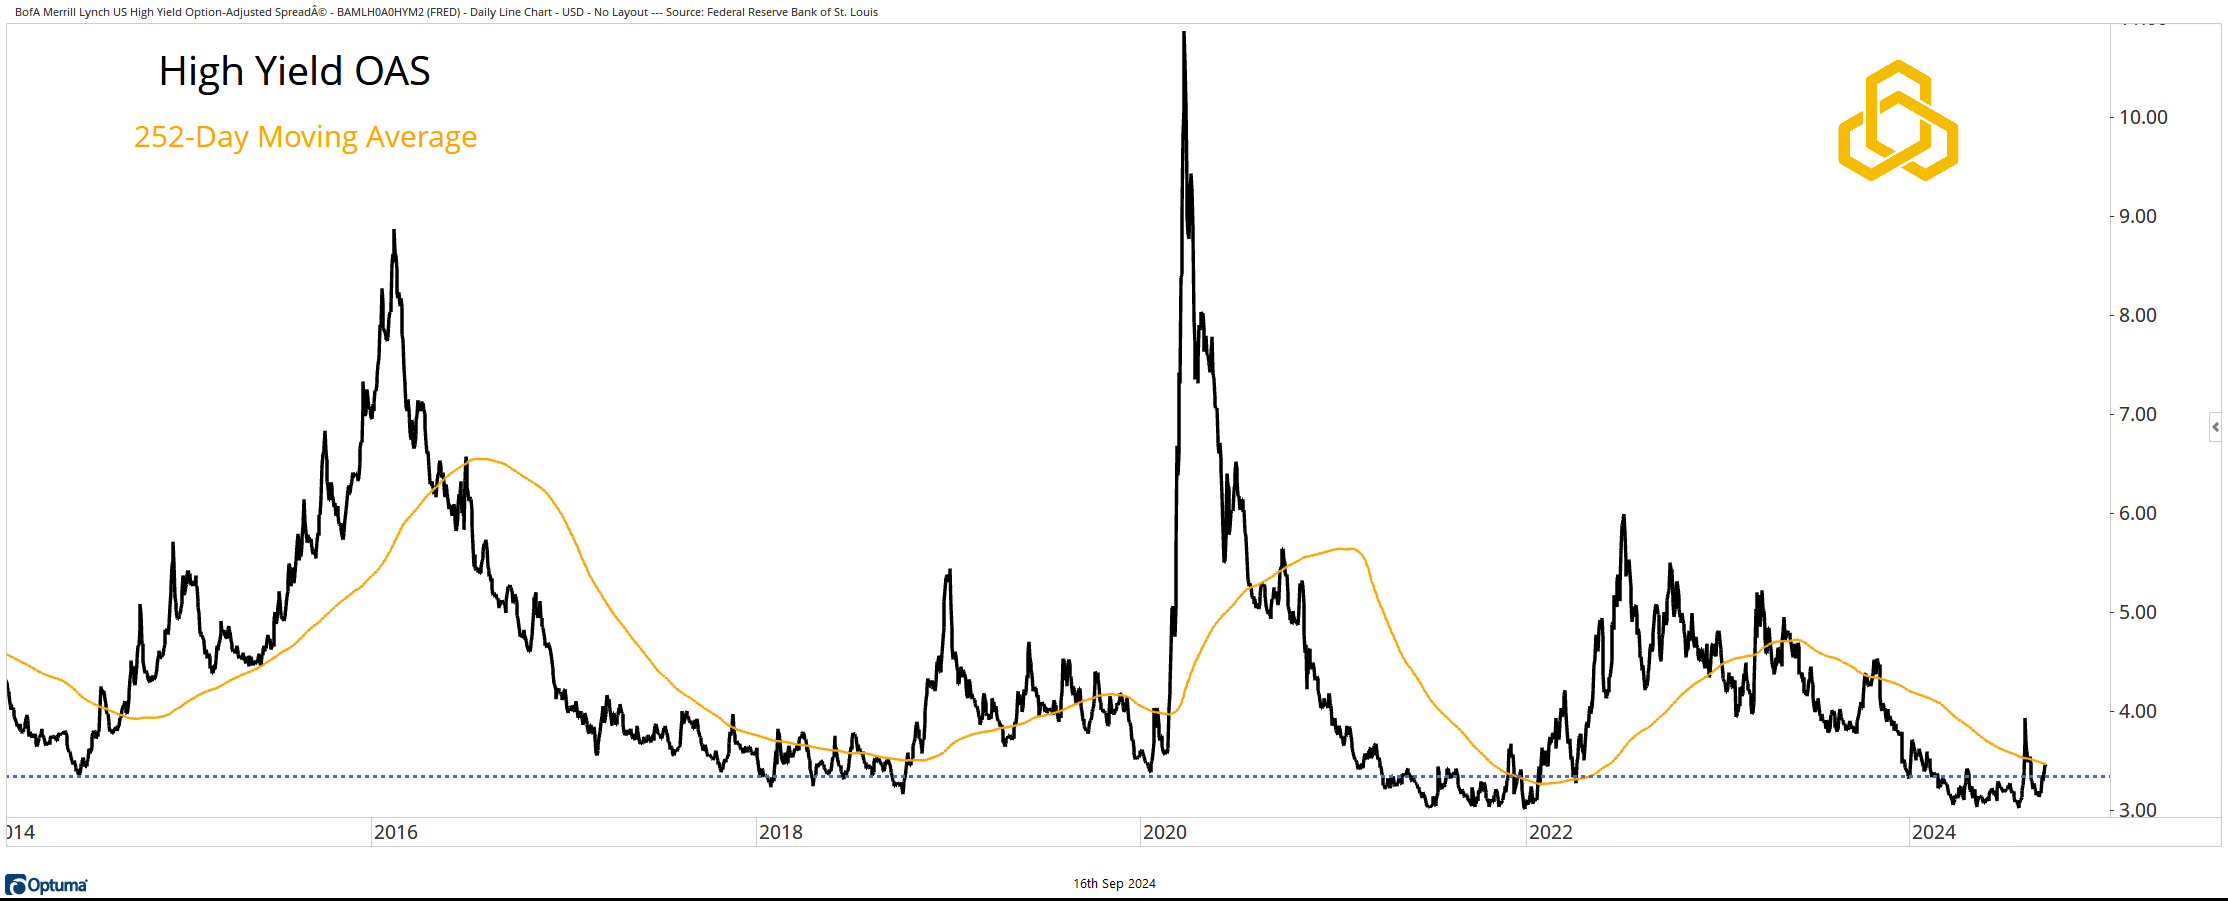
Credit Spreads
Next, I would highlight the fact that the High Yield OAS is testing its 252-day moving average near a level that has been a springboard for moves higher in the past. While the trend has not flipped to the upside yet, this is a logical place for an advance to begin.
Source: Optuma
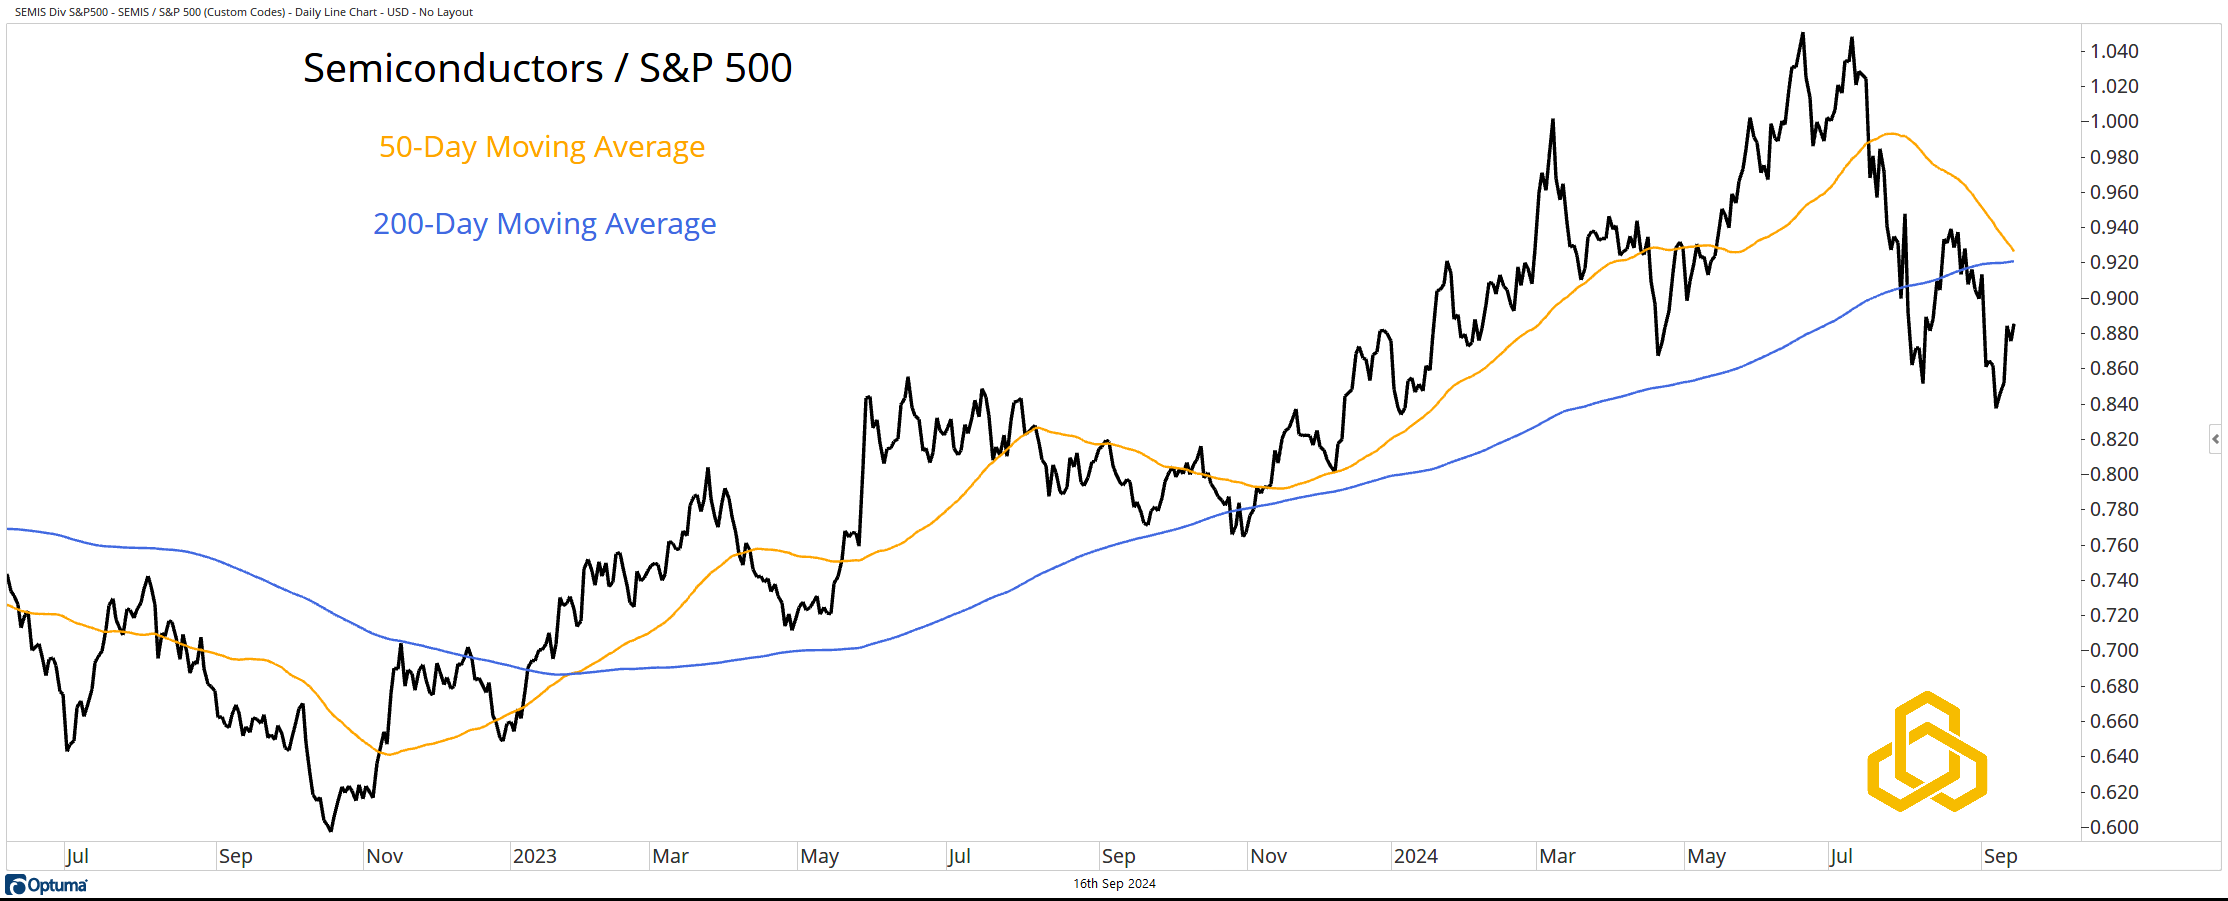
Semiconductors vs. The S&P 500
Finally, I would note that the most important industry group (Semiconductors) in the largest sector of the market (Technology) has been lagging the S&P 500 since June. The ratio is below the 50- and 200-day moving averages, with the former about to cross below the latter.
Source: Optuma
Disclosure: This information is prepared for general information only and should not be considered as individual investment advice nor as a solicitation to buy or offer to sell any securities. This material does not constitute any representation as to the suitability or appropriateness of any investment advisory program or security. Please visit our FULL DISCLOSURE page.
PFM-358-20240916