

Our process is rooted in three key pillars.
-
First, identify the trend in the broad market.
-
Second, assess the health of that trend via breadth metrics.
-
Third, look for confirmation from important intermarket themes.
From there, we add other key data points—such as volatility—to the mix.
This framework has been a key reason for the more cautious commentary in these pages in recent weeks. Now, we turn our attention to what we would expect to see if and when a durable bottom begins to take shape.
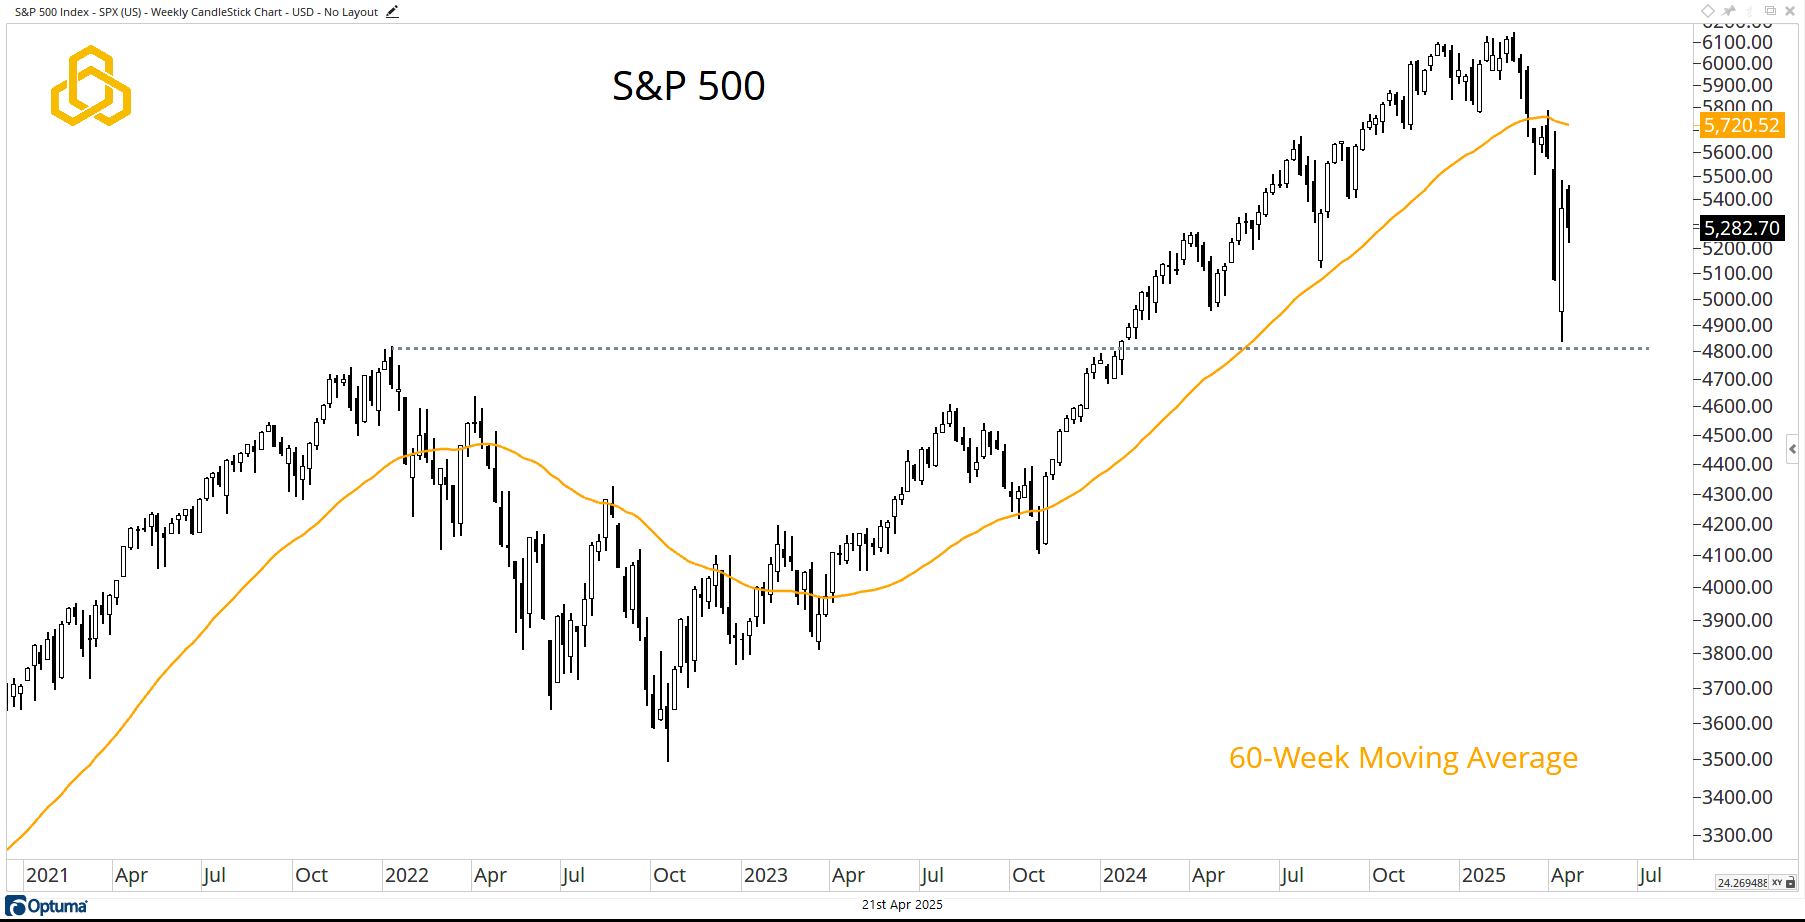
S&P 500
The S&P 500 closed lower during the holiday-shortened trading week and remains below a declining 60-week moving average. Stabilization that allows the moving average to “catch down” to price would be the slower path to forming a bottom. A strong rally from here that recaptures the moving average would resemble the “V-bottom” we’ve all become accustomed to.
Regardless, though not part of our formal process, holding above the early 2022 highs will offer some solace to the bulls.
Source: Optuma
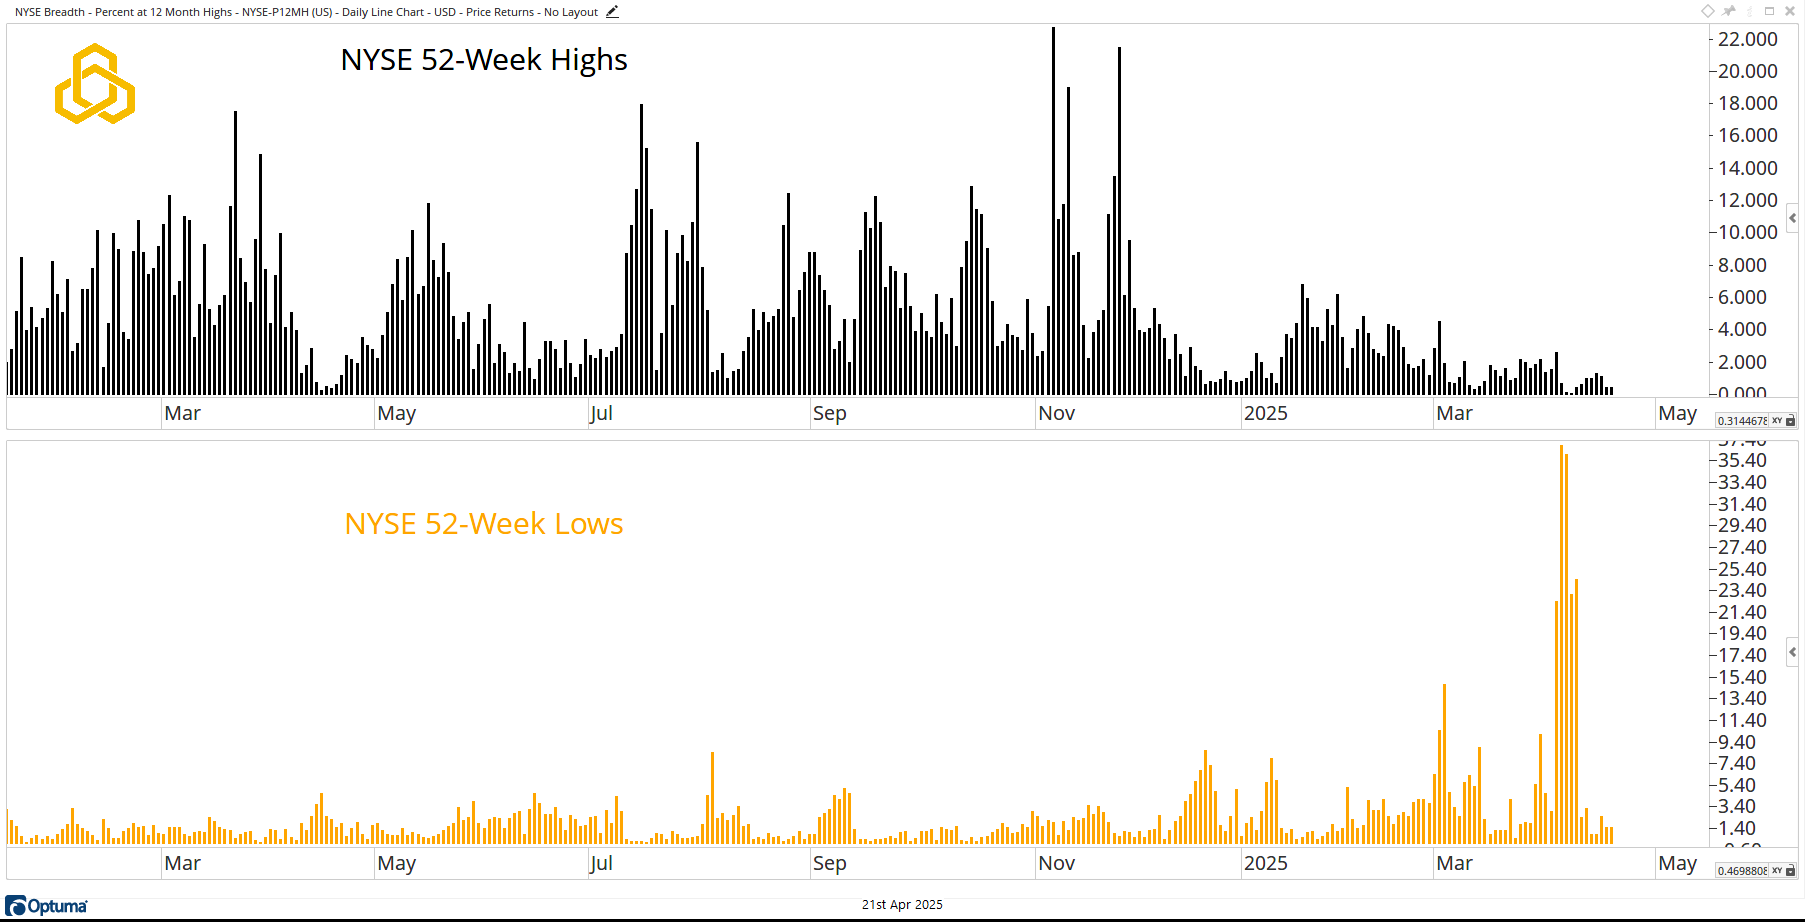
New Highs and New Lows
Last week brought a welcome reprieve in the percentage of NYSE stocks making new lows. This is a step in the right direction for equity bulls. However, it’s worth noting that there was no corresponding uptick in stocks making new highs.
Arguably, stocks must stop going down for a correction to end, but for meaningful upside to take hold, we need to see more stocks making new highs.
Source: Optuma
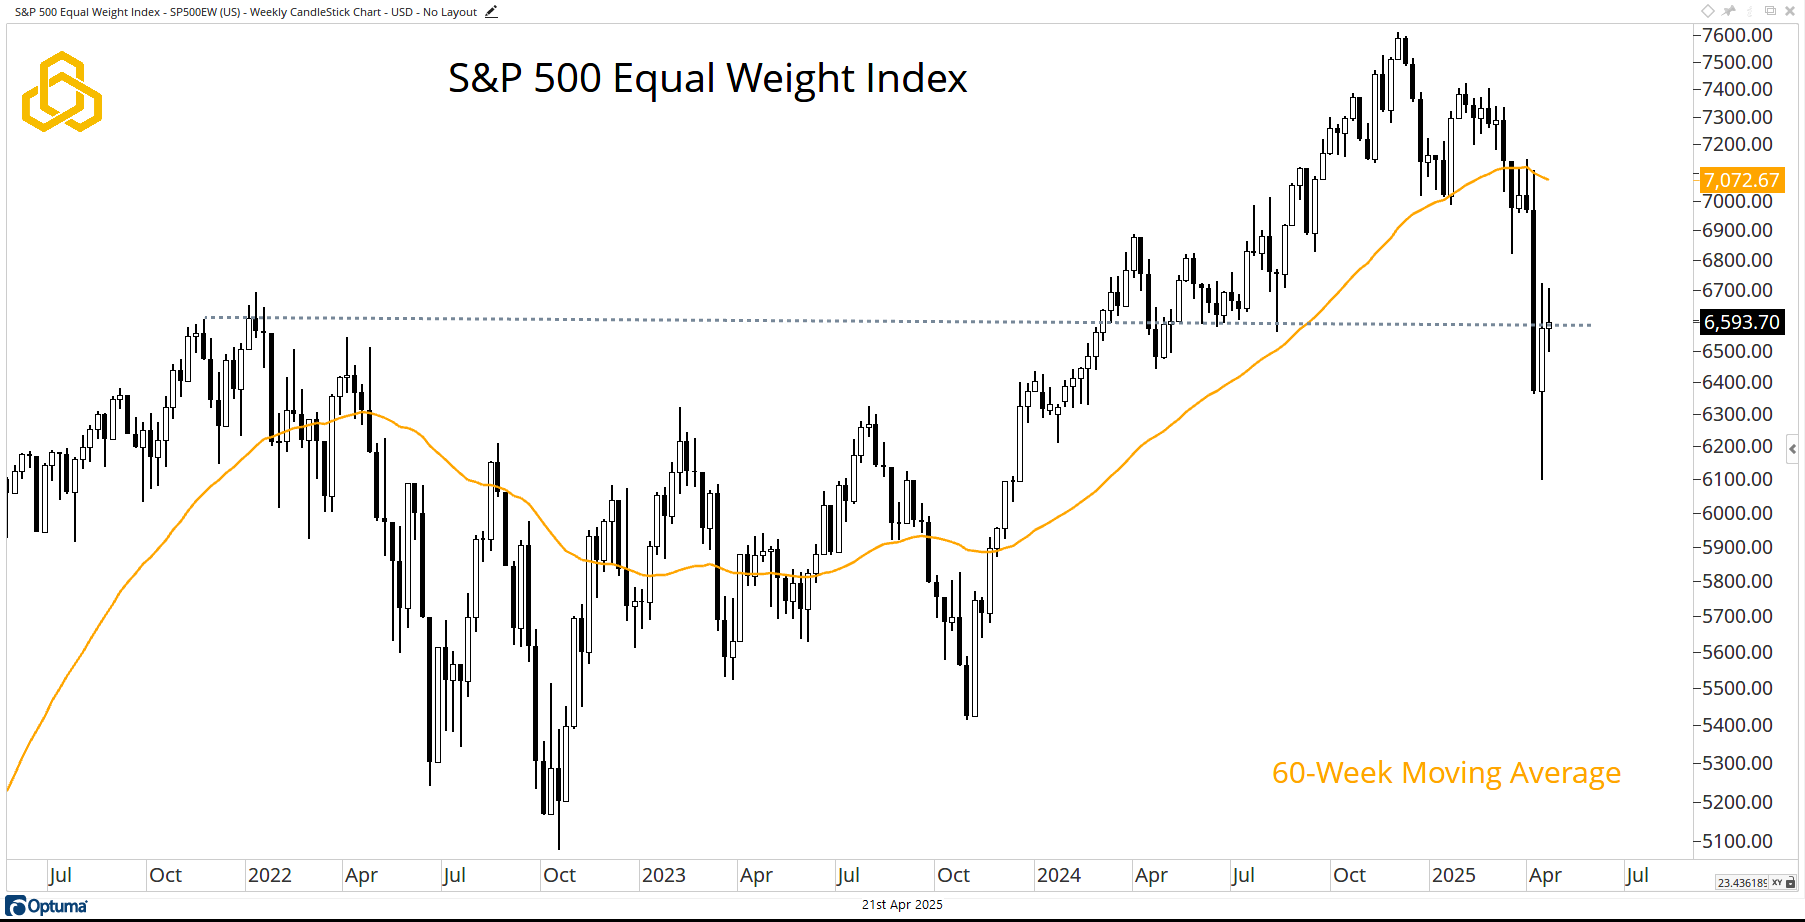
S&P 500 Equal Weight Index
While the S&P 500 closed lower for the week, the equal-weight version of the index managed to close higher for a second consecutive week. Yes, it remains below a declining 60-week moving average, but the average stock appears to be trying to gain a foothold near prior cycle highs.
Source: Optuma
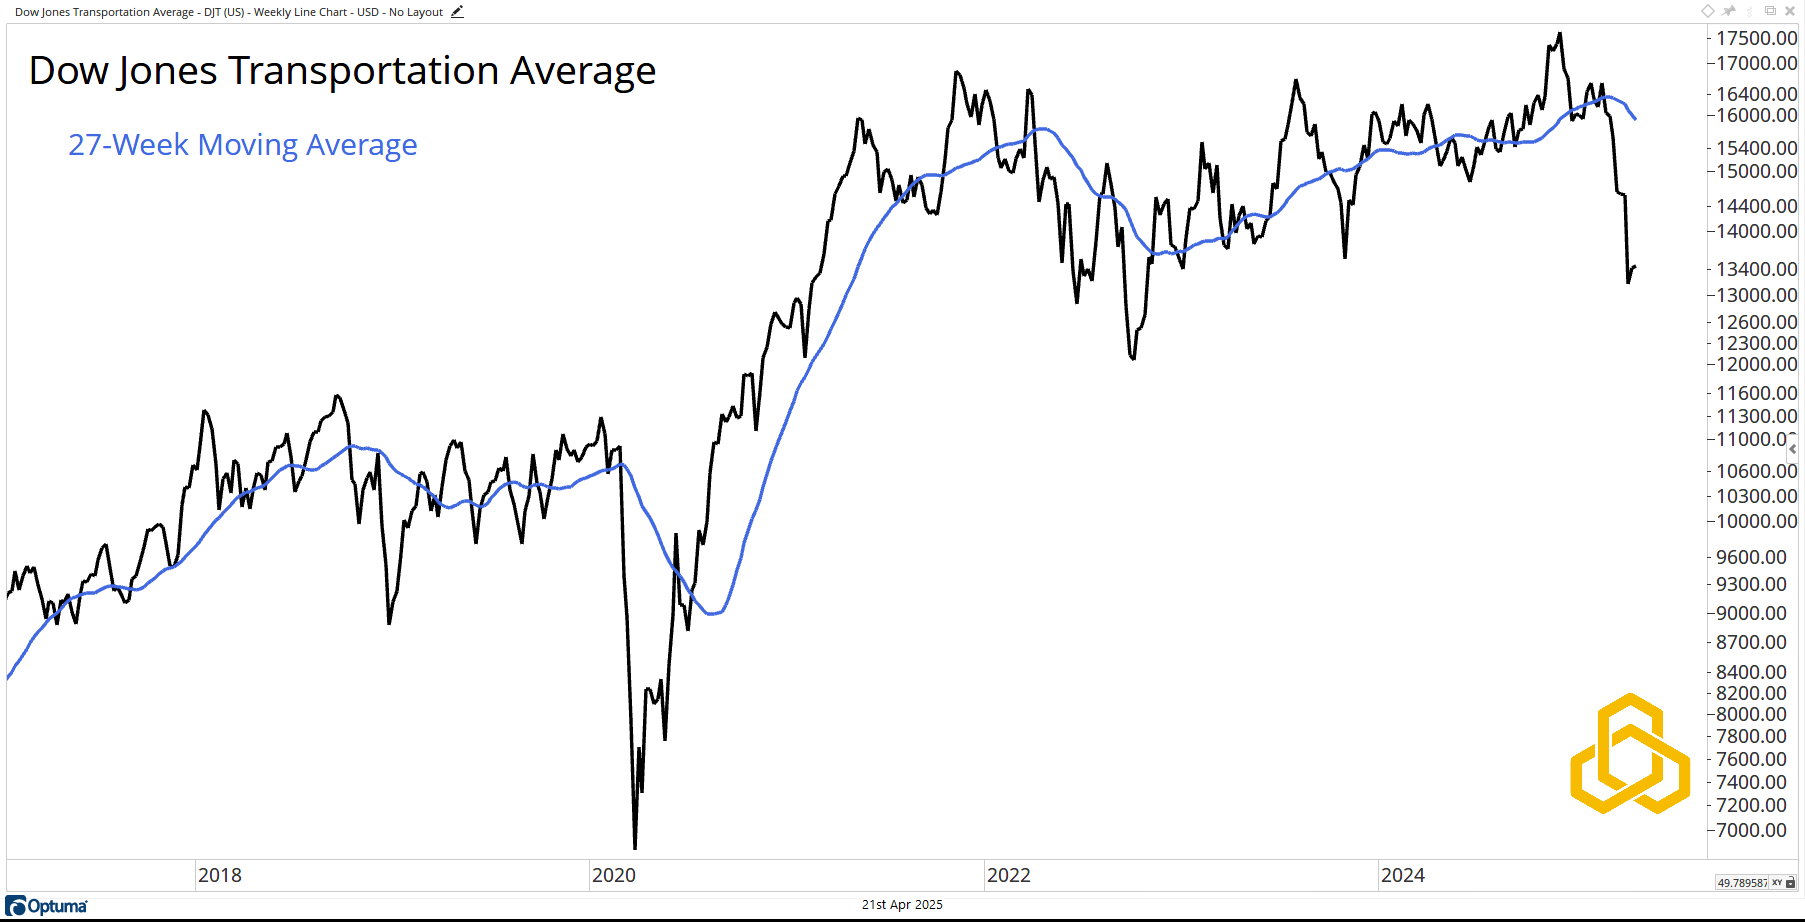
Dow Jones Transportation Average
When studying intermarket themes, we continue to find value in sticking with the classics. Examining the transports for a read on the broader stock market (and economy) was popularized with Dow Theory more than 100 years ago. Despite the age of the concept—and the evolution of both markets and the economy—it still has utility.
The transports remain well below the declining 27-week moving average. Until that changes, it is hard to become overly bullish.
Source: Optuma
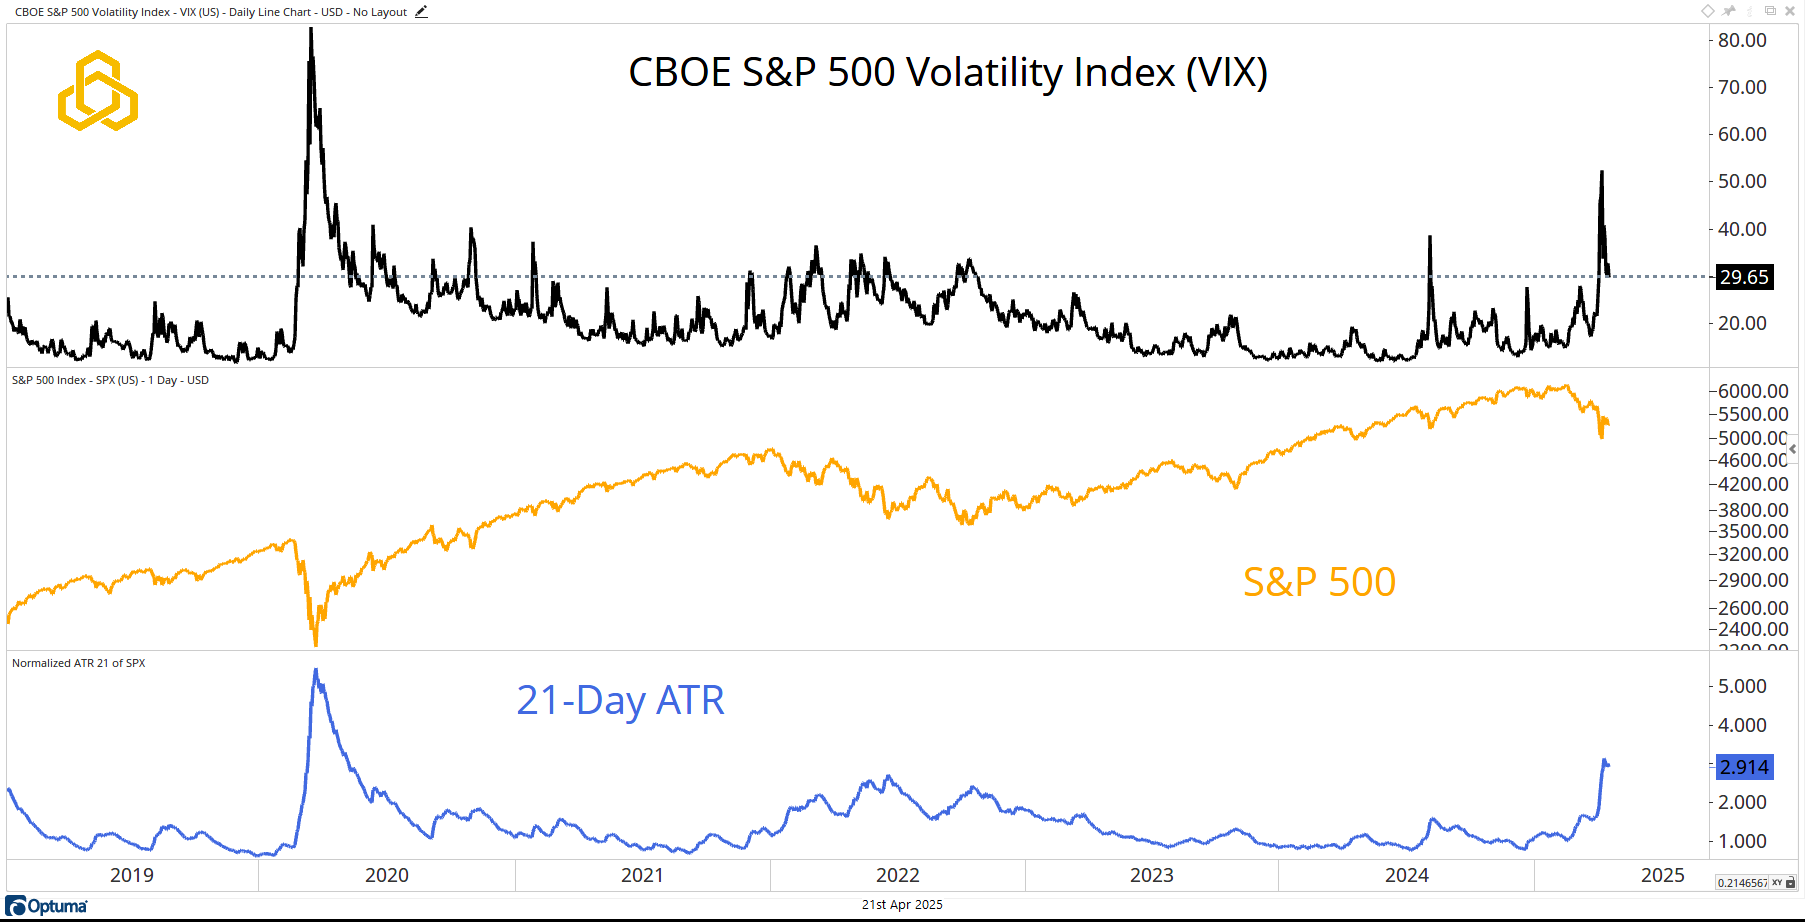
Volatility
To see a sustained move higher for equities, we need to see volatility subside. As the S&P 500 has come under pressure, the CBOE S&P 500 Volatility Index (VIX) has spiked. These spikes are often temporary but tend to last longer than most investors expect.
While most people focus on the VIX, which measures implied volatility, few talk about the Average True Range (ATR), a proxy for realized volatility. The current VIX (29.65 reference) implies that the S&P 500 will move approximately 1.85% per day over the next month. However, the 21-day ATR (2.914% reference) shows that the S&P 500 has been moving nearly 3% per day over the past month.
This is the metric that needs to move lower.
Source: Optuma
Disclosure: This information is prepared for general information only and should not be considered as individual investment advice nor as a solicitation to buy or offer to sell any securities. This material does not constitute any representation as to the suitability or appropriateness of any investment advisory program or security. Please visit our FULL DISCLOSURE page.
PFM-312-20250421