

Let’s be honest, writing this weekly note has become a bore over the past few months. The S&P 500 has exhibited a string of weekly record highs. Breadth has been and remains strong, indicating that the equity trends are healthy. Intermarket themes, such as the Dow Jones Transportation Average, have been confirming. Not much has changed.
Additionally, over the past few months, I have attended multiple investment events where I had the chance to hear presentations from and speak with other investment professionals. A common theme in many of those conversations has been the reemergence of “Value” and a push for more Equal Weight exposure. However, the market seems to have a different view.
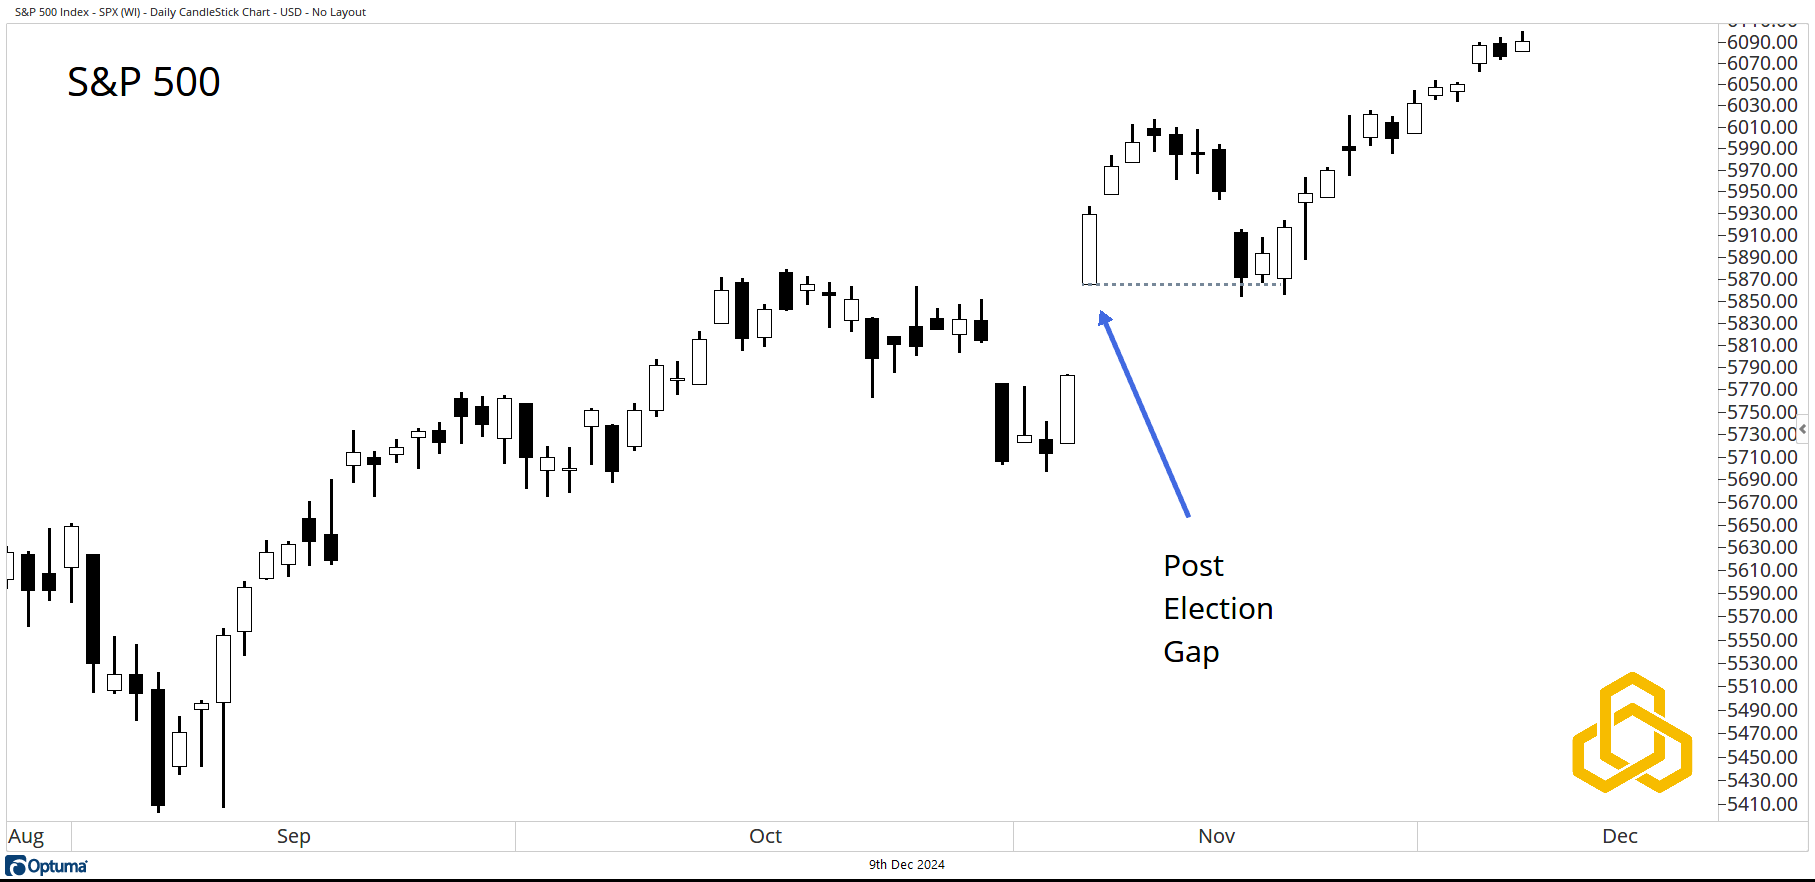
S&P 500
Starting with the S&P 500, we can see that the daily chart traded to a new high on Friday, continuing a strong bullish trend after a successful test of the post-election gap up.
Source: Optuma
The charts that follow are all ratio charts. When the line is rising, the first asset is outperforming the second asset. When the line is falling, the first asset is lagging the second asset.
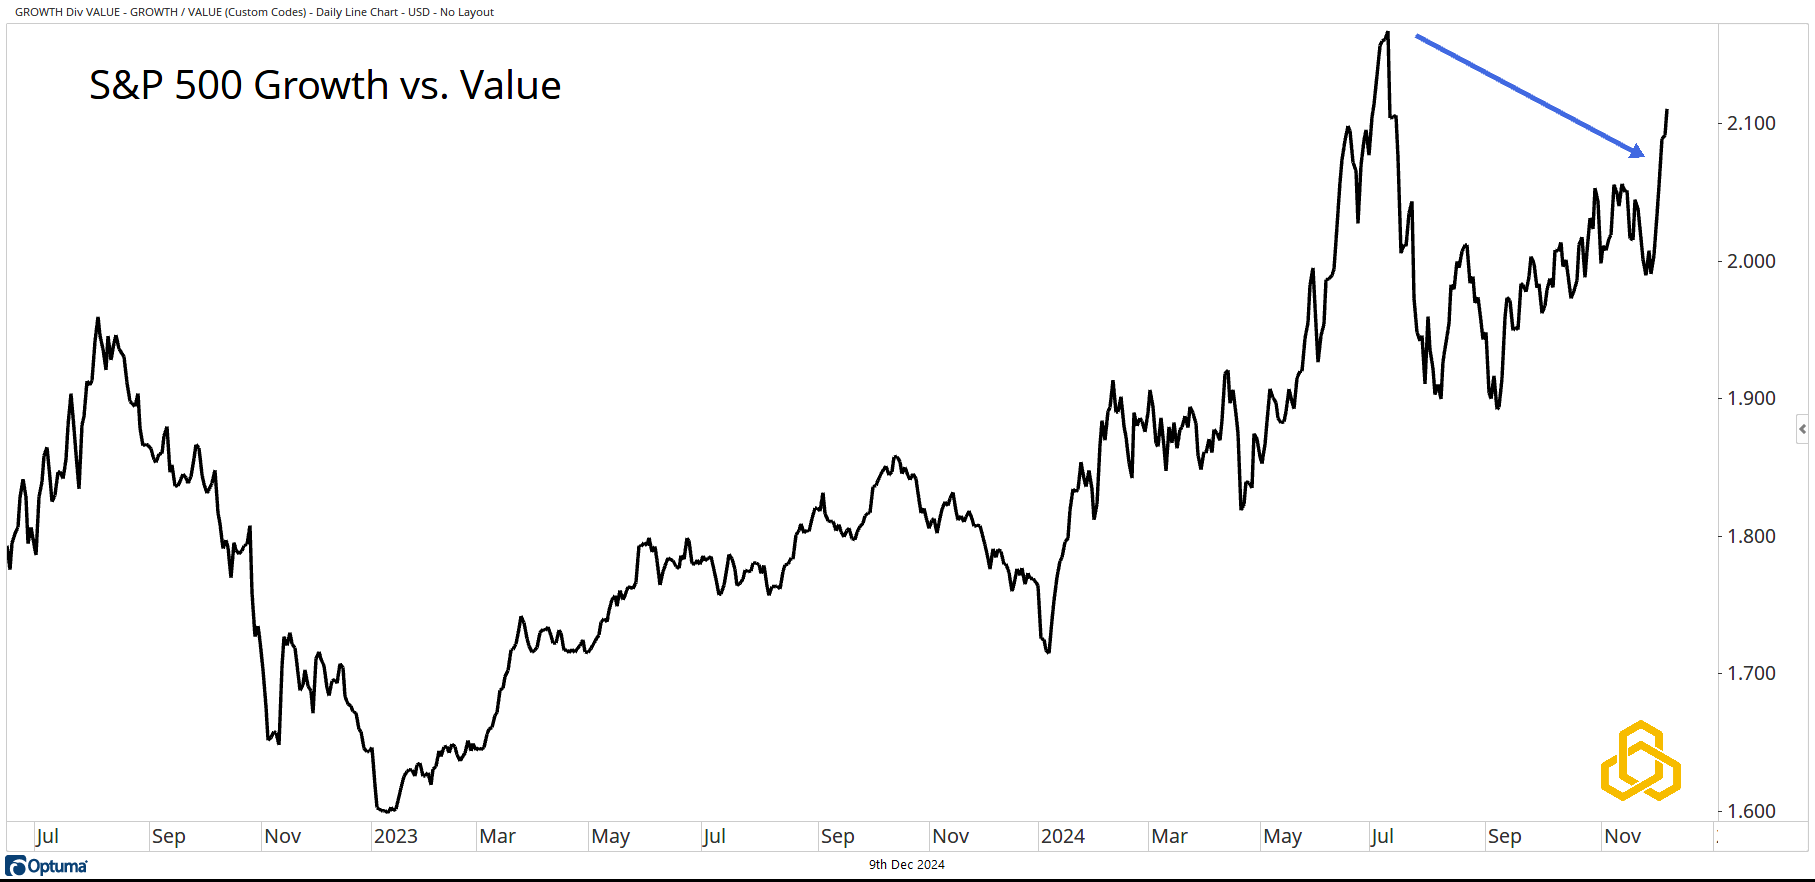
S&P 500 Growth vs. Value
Just as many strategists are pitching the reemergence of “Value” as an idea for 2025, the market appears to be saying, “Not so fast.” The S&P 500 Growth Index has shown strong performance relative to the S&P 500 Value Index of late and appears intent on targeting the July highs.
Source: Optuma
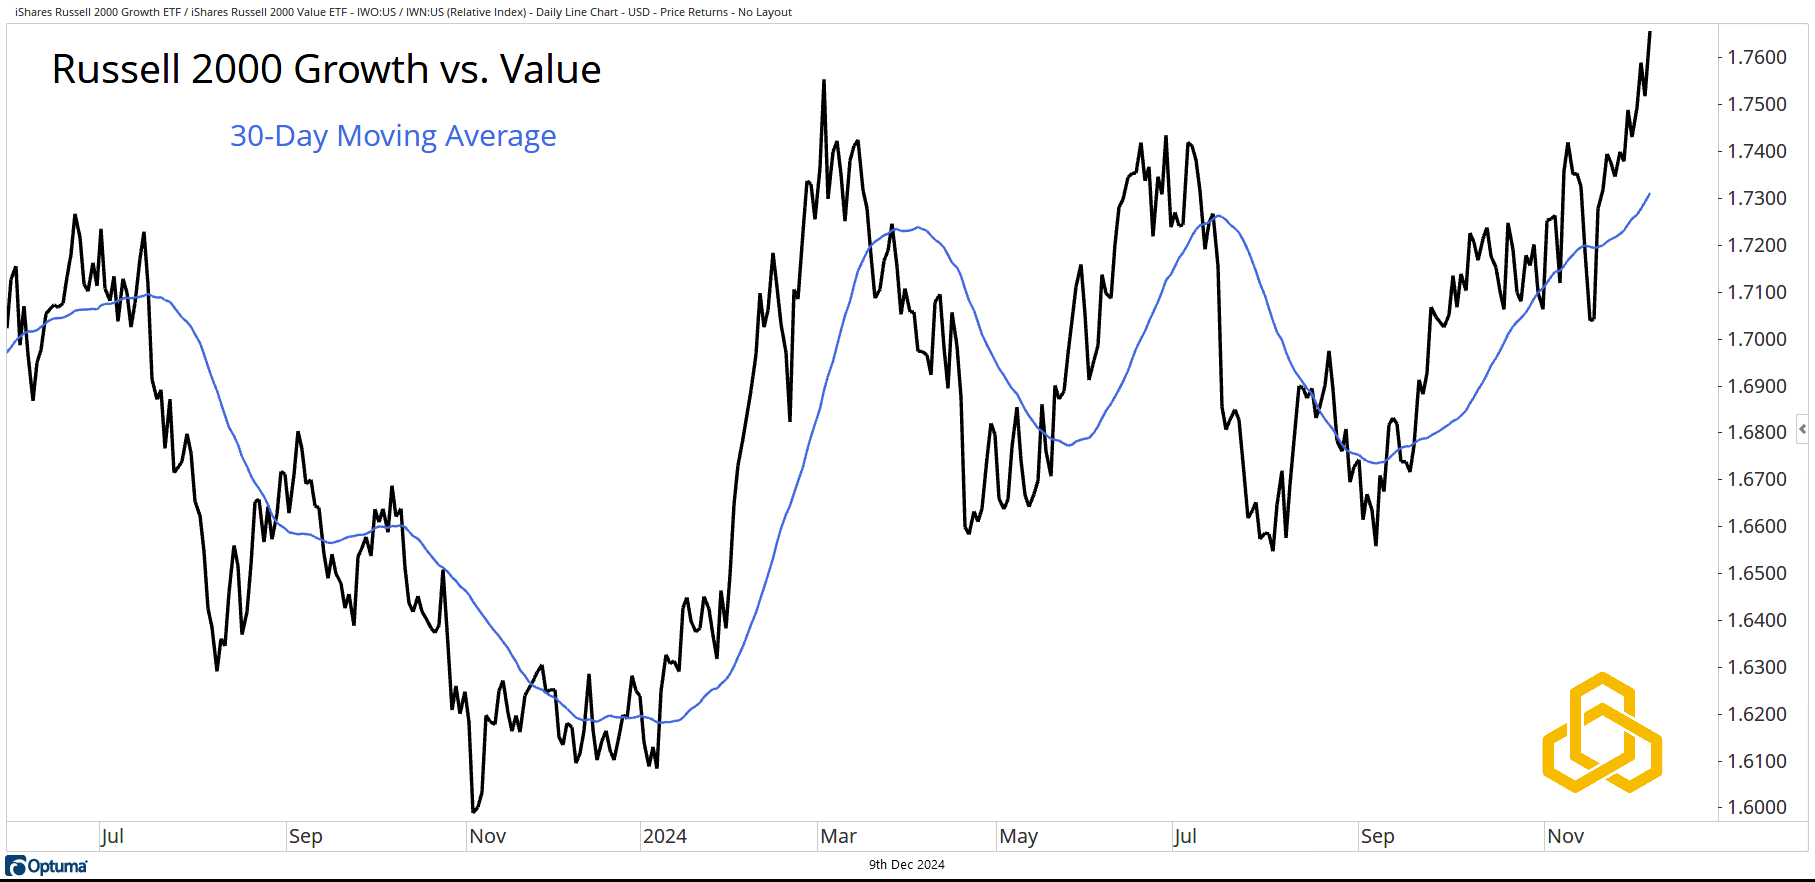
Russell 2000 Growth vs. Value
In the small-cap universe, the growth theme has already broken to new highs and trades above a steadily rising 30-day moving average.
Source: Optuma
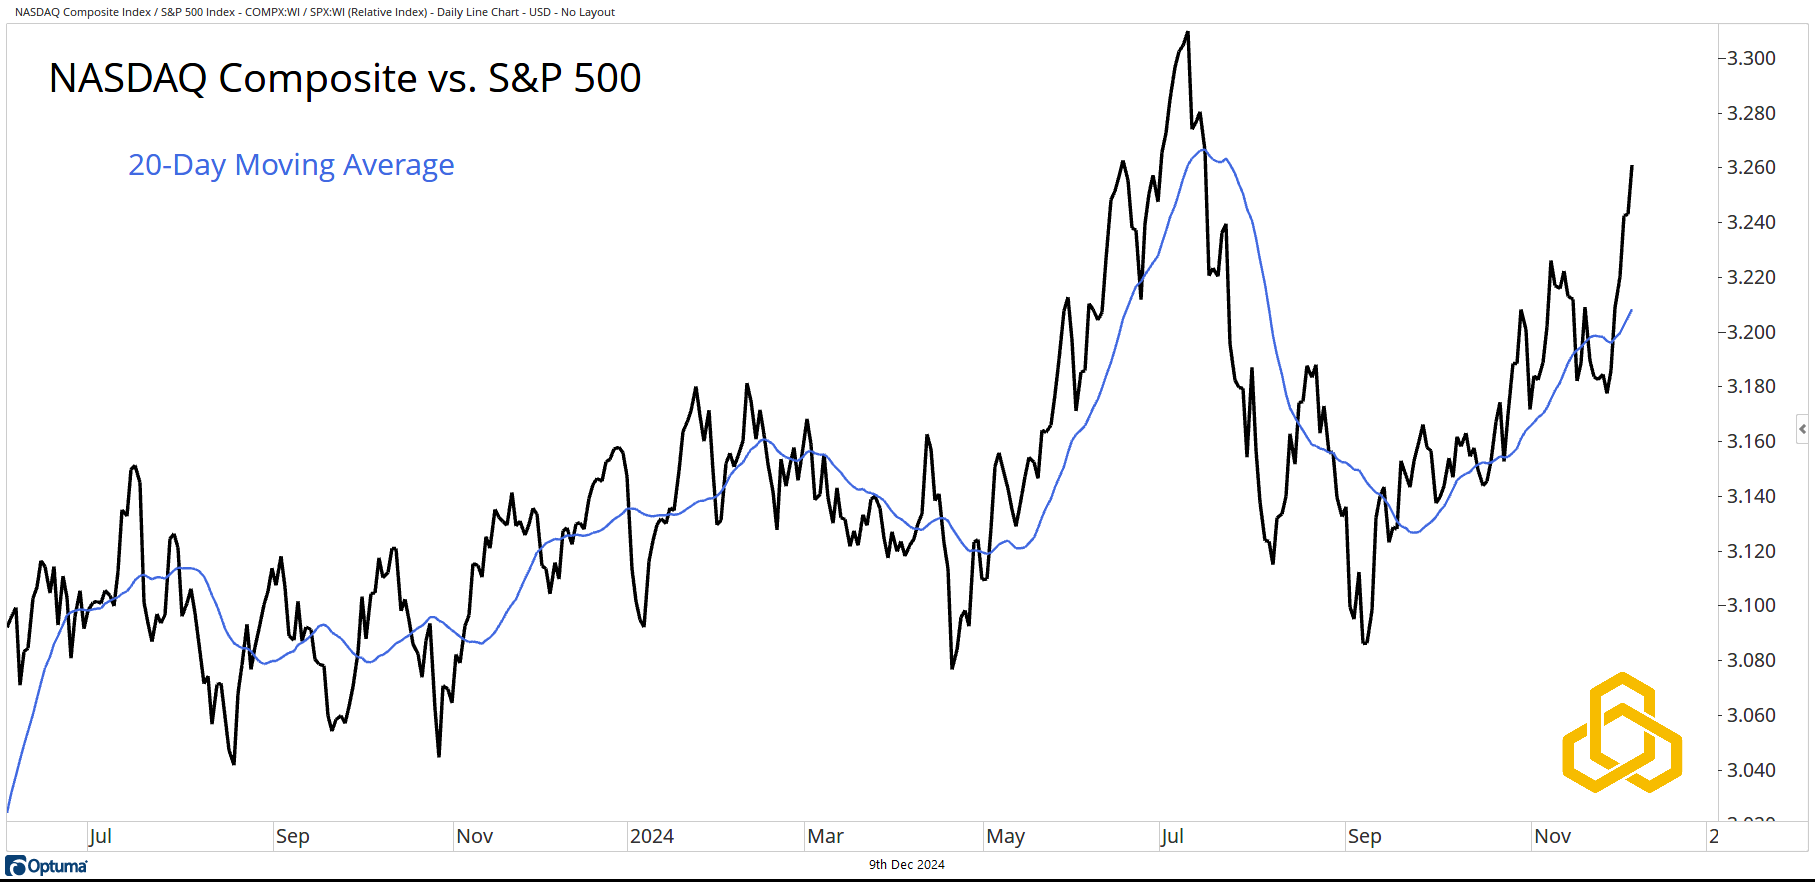
NASDAQ Composite Index vs. S&P 500
The NASDAQ Composite Index encompasses more than just the NASDAQ 100. It includes the mega caps that we all follow every day as well as smaller stocks that are not household names. Arguably, there is a growth tilt to the index.
The ratio is accelerating to the upside above the 20-day moving average, with its sights set on the July highs.
Source: Optuma
S&P 500 Equal Weight vs. Cap Weight
The cap-weighted S&P 500 is top-heavy with “growth” stocks. A way to neutralize that dynamic is to analyze the index on an equally weighted basis. However, comparing the S&P 500 to its equal-weight sibling shows that equal weight has been—and remains—a clear underperformer. The ratio is moving lower, below the declining 200-day moving average.
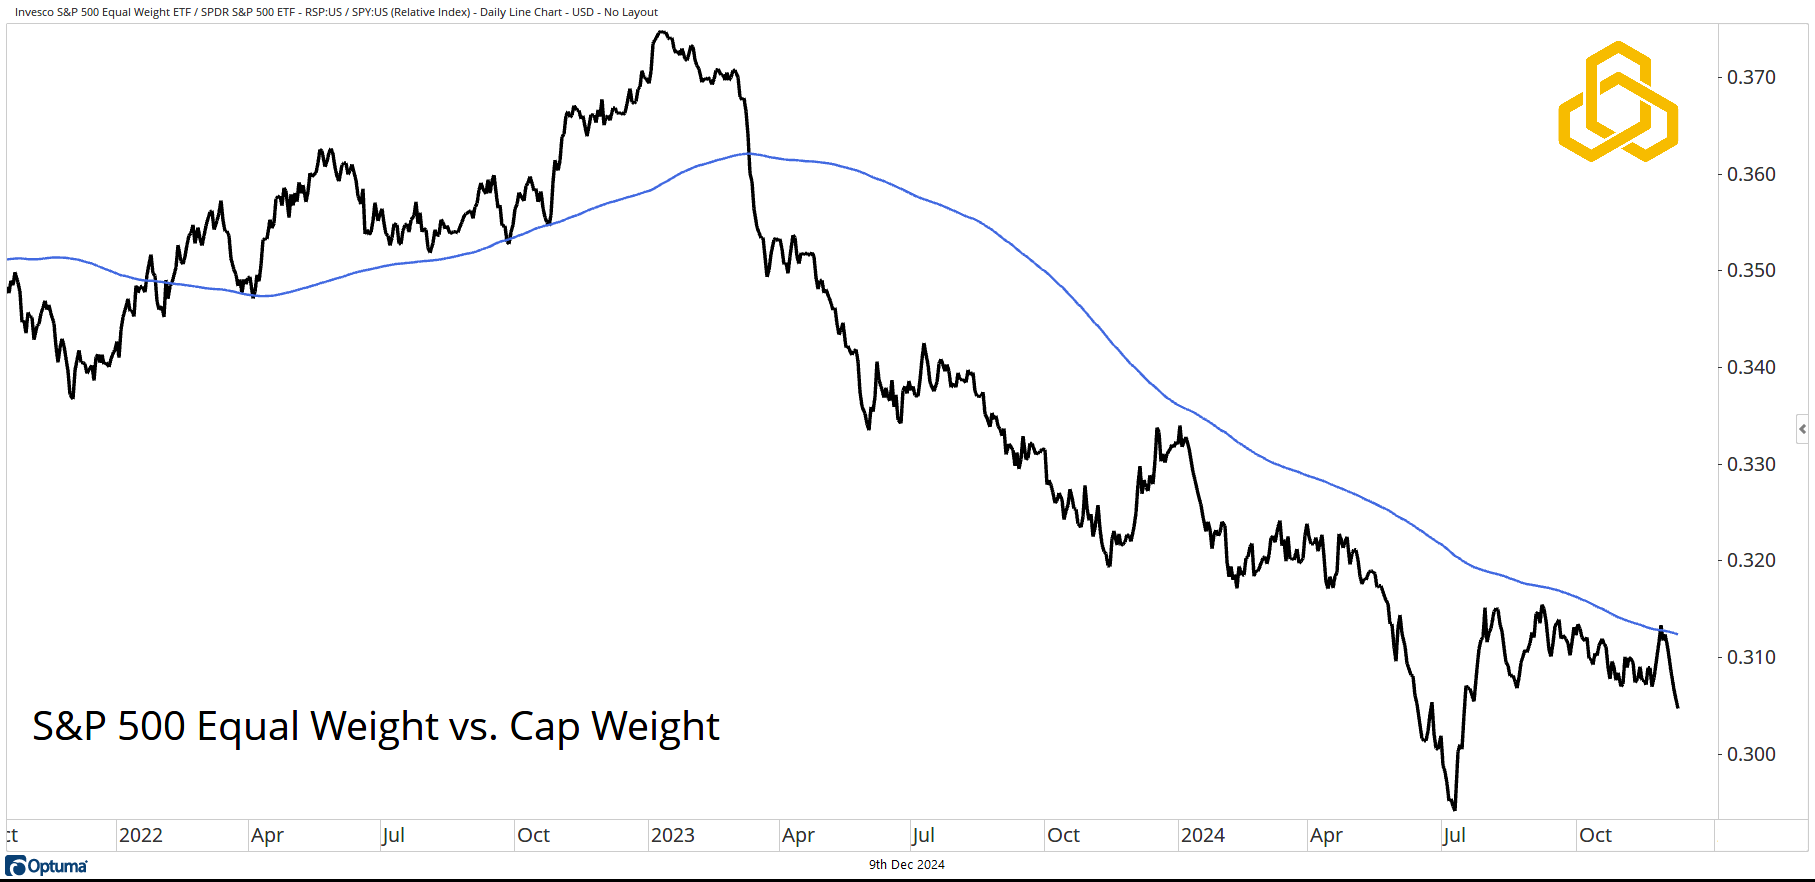
Source: Optuma
Disclosure: This information is prepared for general information only and should not be considered as individual investment advice nor as a solicitation to buy or offer to sell any securities. This material does not constitute any representation as to the suitability or appropriateness of any investment advisory program or security. Please visit our FULL DISCLOSURE page.
PFM-377-20241209