Dow Divergence
April 8, 2024
Divergences are one of the most widely discussed phenomena in markets. They’re common because people are drawn to bearish content, and most of the time those are the examples chosen.
What is a divergence?
According to Investopedia.com, it’s “when the price of an asset is moving in the opposite direction of a technical indicator, such as an oscillator, or is moving contrary to other data.”
For anyone with a quantitative and objective lens, there are major problems when attempting to test divergences on historical data.
How will we define it?
How much does one datapoint need to diverge from the other?
Over what time frame? When to enter? When to exit?
The research process is complex and may be too time-consuming for the average investor to perform properly.
We will examine two examples to answer the questions above, assign rules, and examine the outcomes according to a thesis.
The three components of the study are the Dow Jones Industrial Average (Dow), Dow Jones Utility Average (Utilities) and Dow Jones Transportation Average (Transports). This list is not inclusive of all potential divergences.
The proposed theory, rooted in Intermarket Analysis, is that if the Utilities or Transports are declining while the Dow is not in the same magnitude (divergence), then the forward returns for the Dow will be meaningfully lower than normal, if not negative. Students of the market will recognize an element of Dow Theory in this work.
A common problem is that certain divergences are excluded to skew results in favor of the story being told. To objectively quantify and test data there must be rules and all trades must be included.
Test #1: 5% Divergence
For the purpose of this analysis, an entry is needed and takes place when all three indices are less than 5% from their all-time highs.
However, the more important part of this exercise is the exit, as the thesis states that the Dow will perform poorly after the sell signal.
The exit is when either the Utilities or the Transports are more than 10% below their highs and the Industrial index is less than 5% from its high.
In simpler terms, sell when there is at least a 5% divergence between the Utilities or Transports vs. the Industrials near their highs
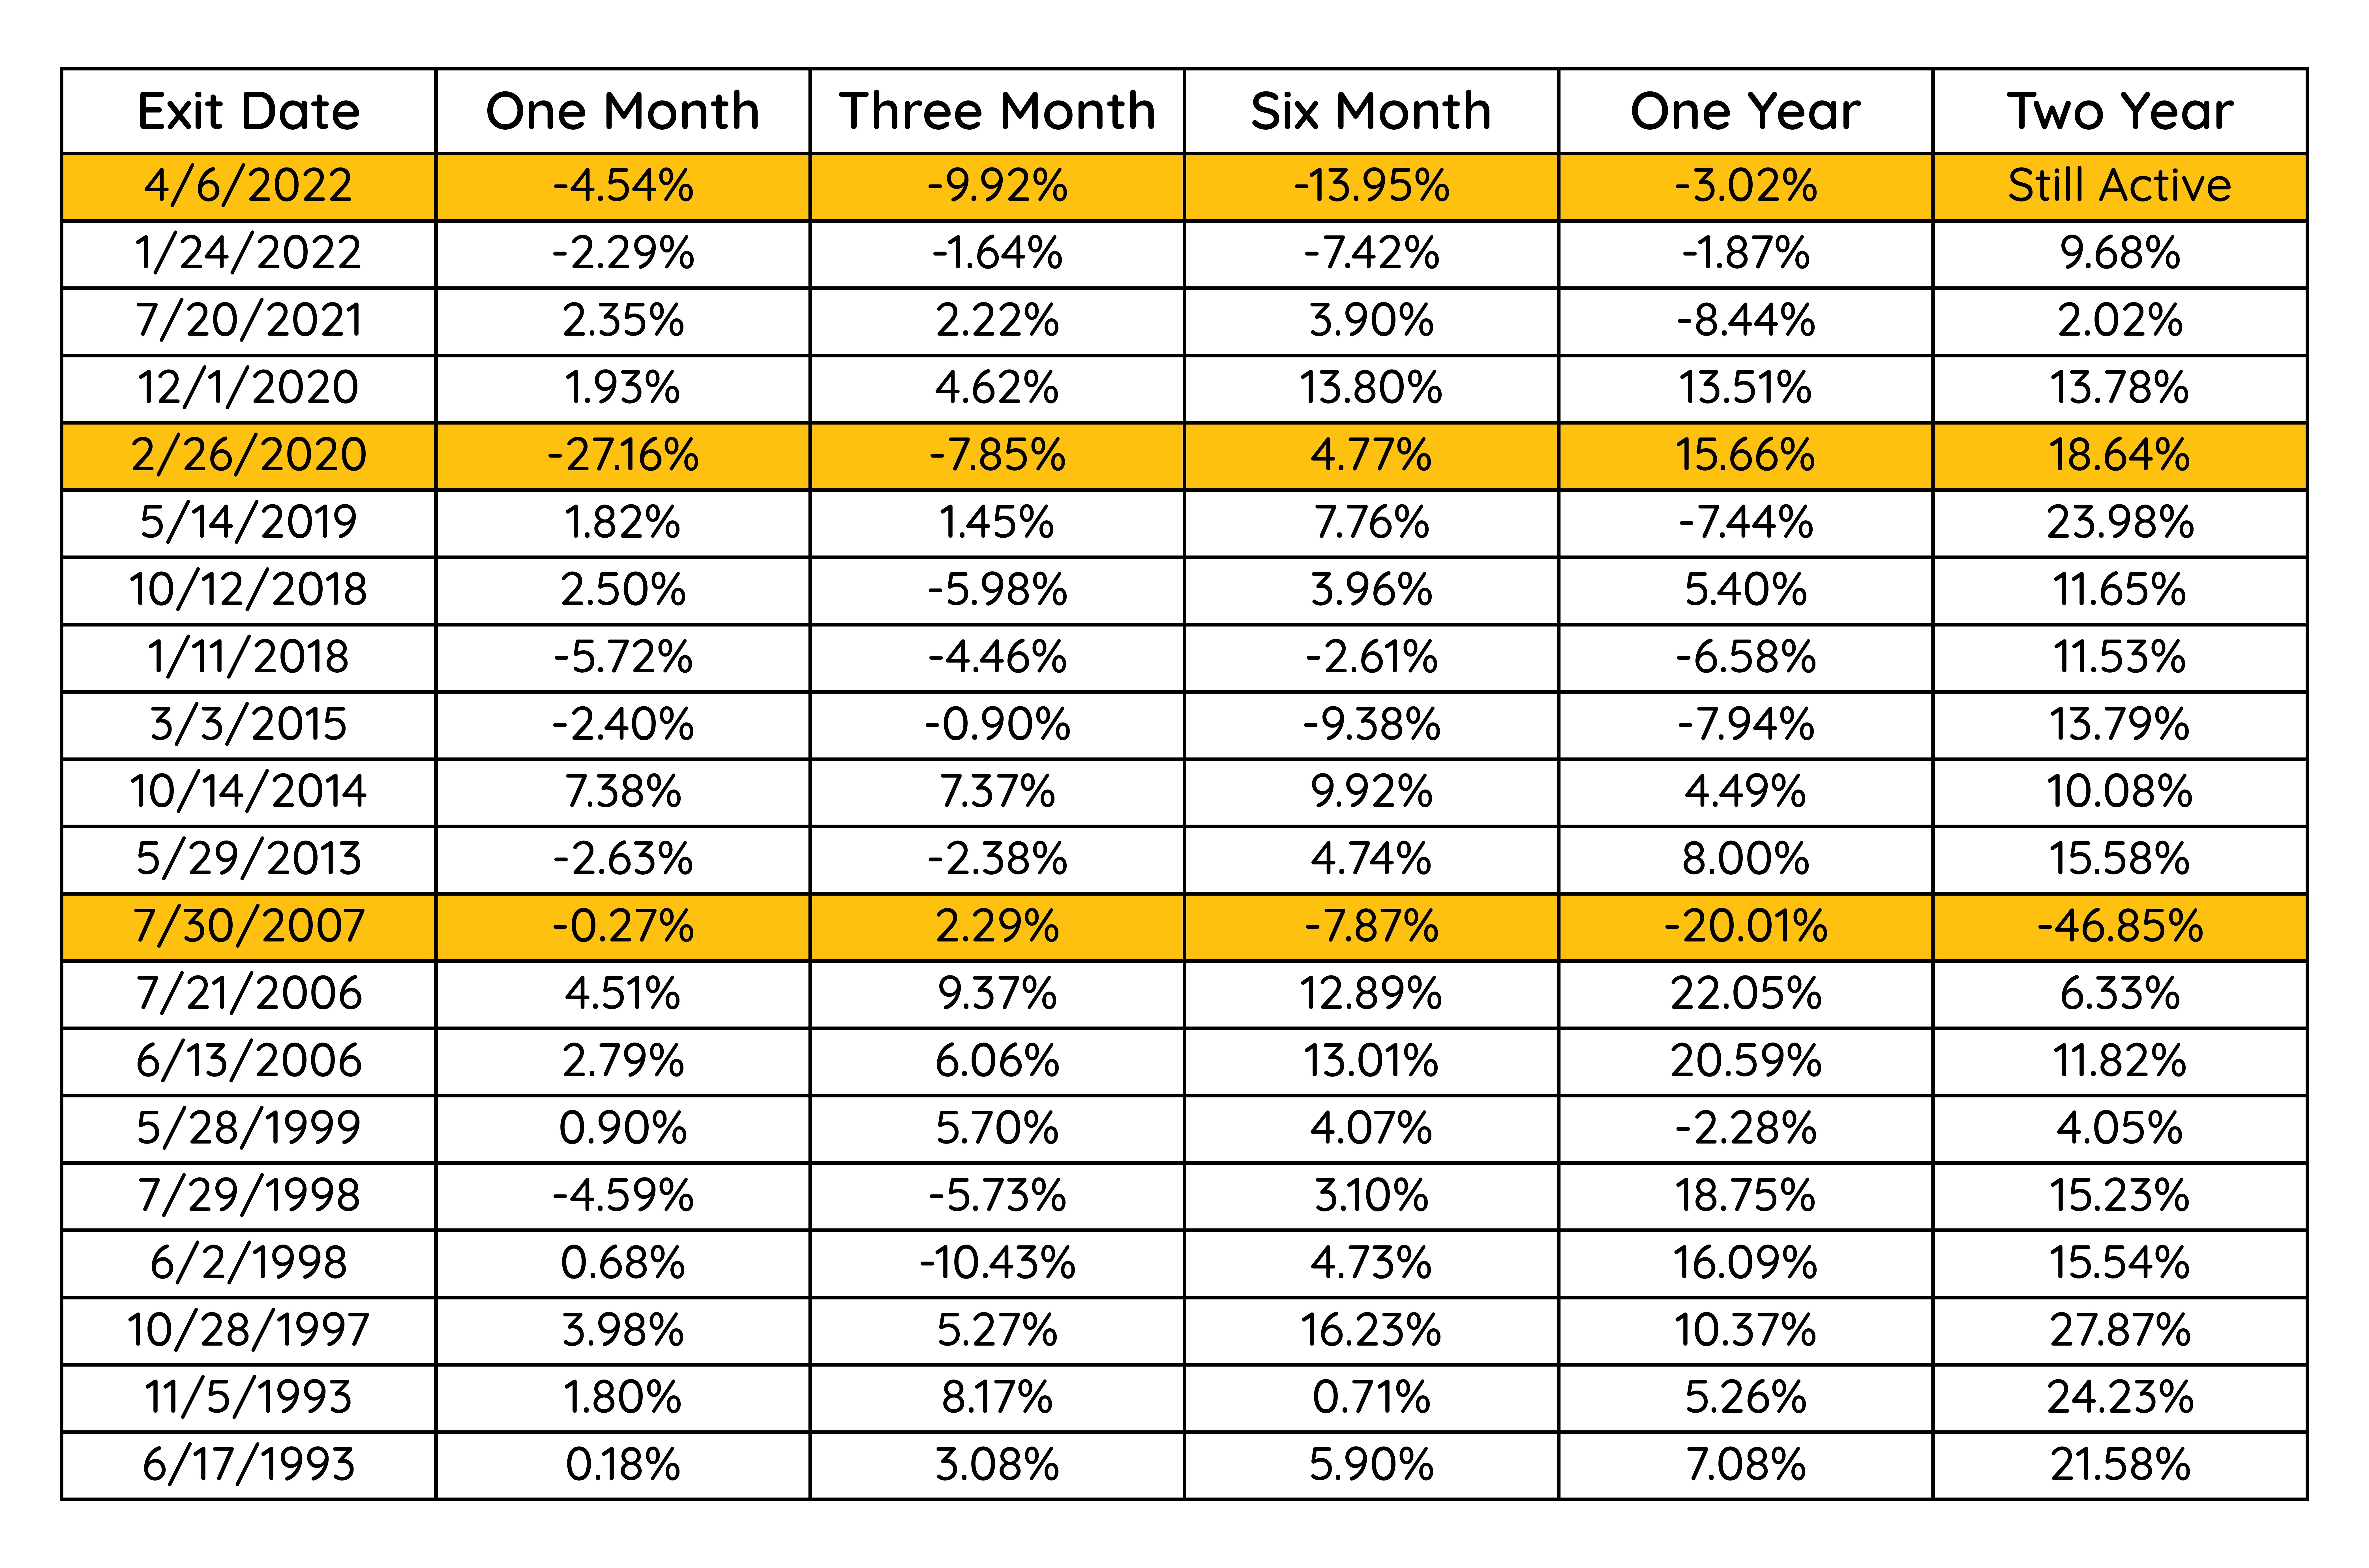
Below are the exit dates since 1990 along with the forward returns of the Industrials for differing time periods. Highlighted are some of the largest future drawdowns:

This table is a summary of the information above:

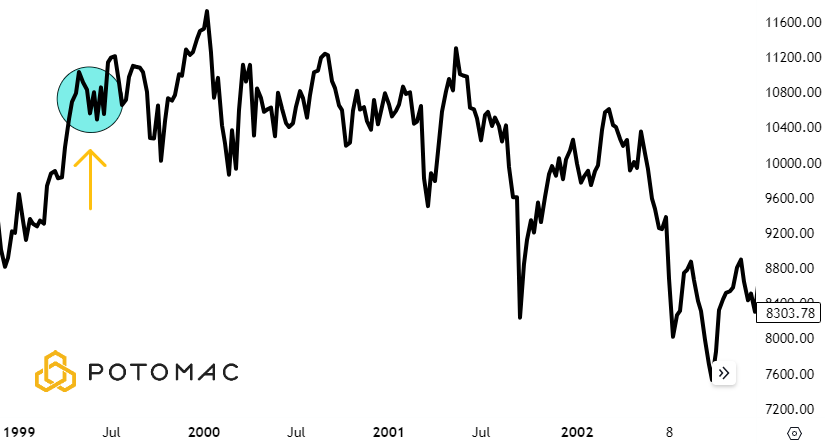
To visualize one of the topping signals, here is the chart of the Industrials. The exit date was July 30, 2007, indicated by the yellow arrow. In this case, the Utilities drawdown was –11.37%, triggering the sell.

When analyzing forward returns in this way, both the mean and median must be included as there may be an outlier that skews the average result. Aside from the six-month median, every time frame after the signal produced lower returns relative to all periods.
What about accuracy of the call over the short-term?
74.1% of rolling 21-day periods were positive for the Dow since 1990. Over the same timeframe, only 60% were positive following the divergence signal. A clear degradation
At the end of the day, do we want to be long or not? This is the question we must answer as money managers.
In this case, following the signal, the evidence points to the market being weaker than normal across all time frames examined. But the evidence isn’t significant enough to warrant a short position as the Dow still ended positive after all timeframes excluding the 21-day mean.
What comes next in the research process?
We could write it off as another inconclusive idea that has been tested. Or we could adjust the parameters.
Test #2: Bear Market Divergence
Most consider bear markets to be anything greater than a 20% decline. This time we’ll adjust the rules to reflect selling when either the Transports or Utilities enter a bear market (-20%) before the Industrials. With the same thesis that the Dow will perform poorly at some interval after.
The entry will stay the same. All three components must be less than 5% from their all-time high. The exit is when either the Utilities or Transports enter a drawdown greater than 20%.
In this case, we’d expect less trades because the exit takes longer to activate. This allows more time in the market before the Dow is sold and may result in more impactful signals, although at a reduced sample size.
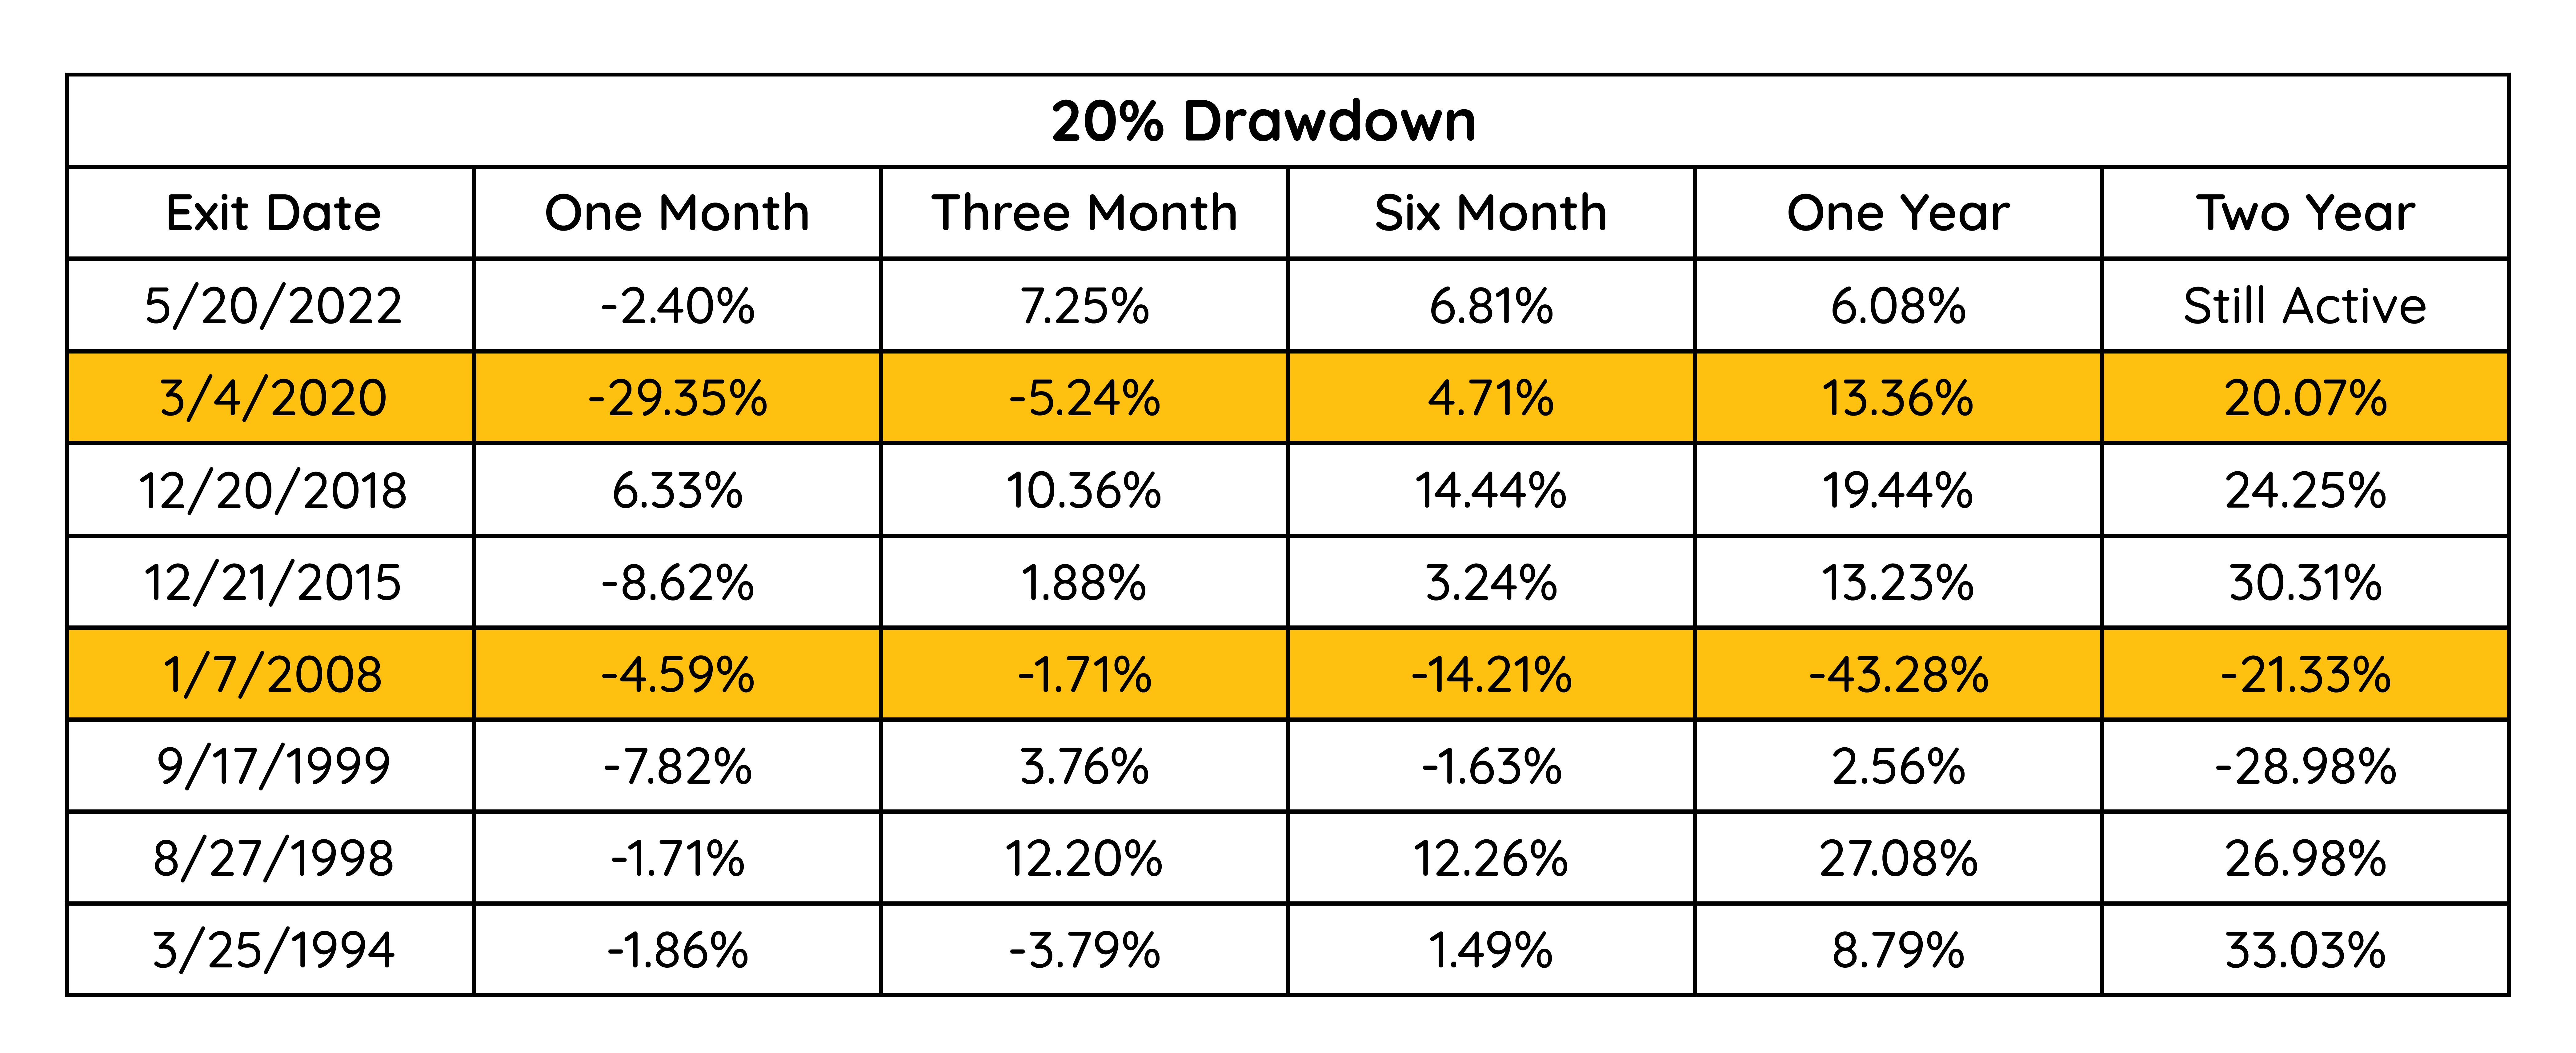
These are the exit dates with forward returns in the same format as shown before with a couple of well-timed exits highlighted. All exits followed a divergence of greater than 5%.

The table summarizing:

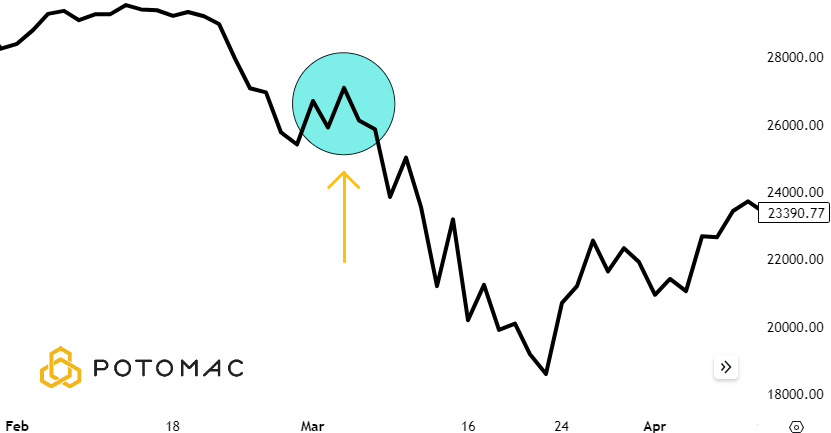
To visualize one of the highlighted trades, view the chart of the Industrials below. The exit date was in the early part of the Covid crash indicated by the yellow arrow. The Transports entered a –20.48% drawdown, triggering the signal.

Following the signal, one-month returns were extremely negative for both the mean and median. That is compared to all periods which showed positive readings.
What about the accuracy short-term?
As stated before, 74% of rolling 21-day periods were positive for the Dow since 1990. Following this sell signal, only 12.5% were positive.
Final Question
Are the results strong enough to include inside our composite models alongside other rigorously tested signals? More research is needed before that conclusion can be drawn.
As you’ve seen, the research process is intensive, and finding a robust signal is rare. In this case, we took what is a common topic and tested it both objectively and quantitatively. The original thesis stated that the forward returns for the Dow will be meaningfully lower than normal, if not negative.
For the 10% divergence example, nearly all periods were weaker than the norm going forward. For the 20% divergence, the forward one-month average and mean returns were negative. Time periods beyond that were a mixed result.
Conclusion
The Dow’s forward returns appear to be dampened when either Utilities or Transports enter a 10% drawdown ahead of Industrials, but not negative. As that divergence deepens to 20%, the odds of negative returns over the following month are significantly elevated. We are mindful that sample size may not be sufficient to warrant a complete system, but the short-term results are compelling enough for further study.
*All charts are from Tradingview.com as of March 21, 2024. All data for tables are sourced from Norgate. They are for illustrative purposes only. Past performance is not indicative of future results.
PFM-315-20240404
