

There has been much talk in the bearish community this year about divergences. Divergence is a term for when one market or indicator does not confirm the strength or weakness seen in a different market. Divergences alone are not a trading signal, but more of a warning flag. They can often resolve themselves through time without a meaningful degradation in price.
However, sometimes there is an event or a catalyst that wakes investors to the divergence and causes them to care. Perhaps an escalation of tension in the Middle East can serve as that catalyst? Only time will tell.
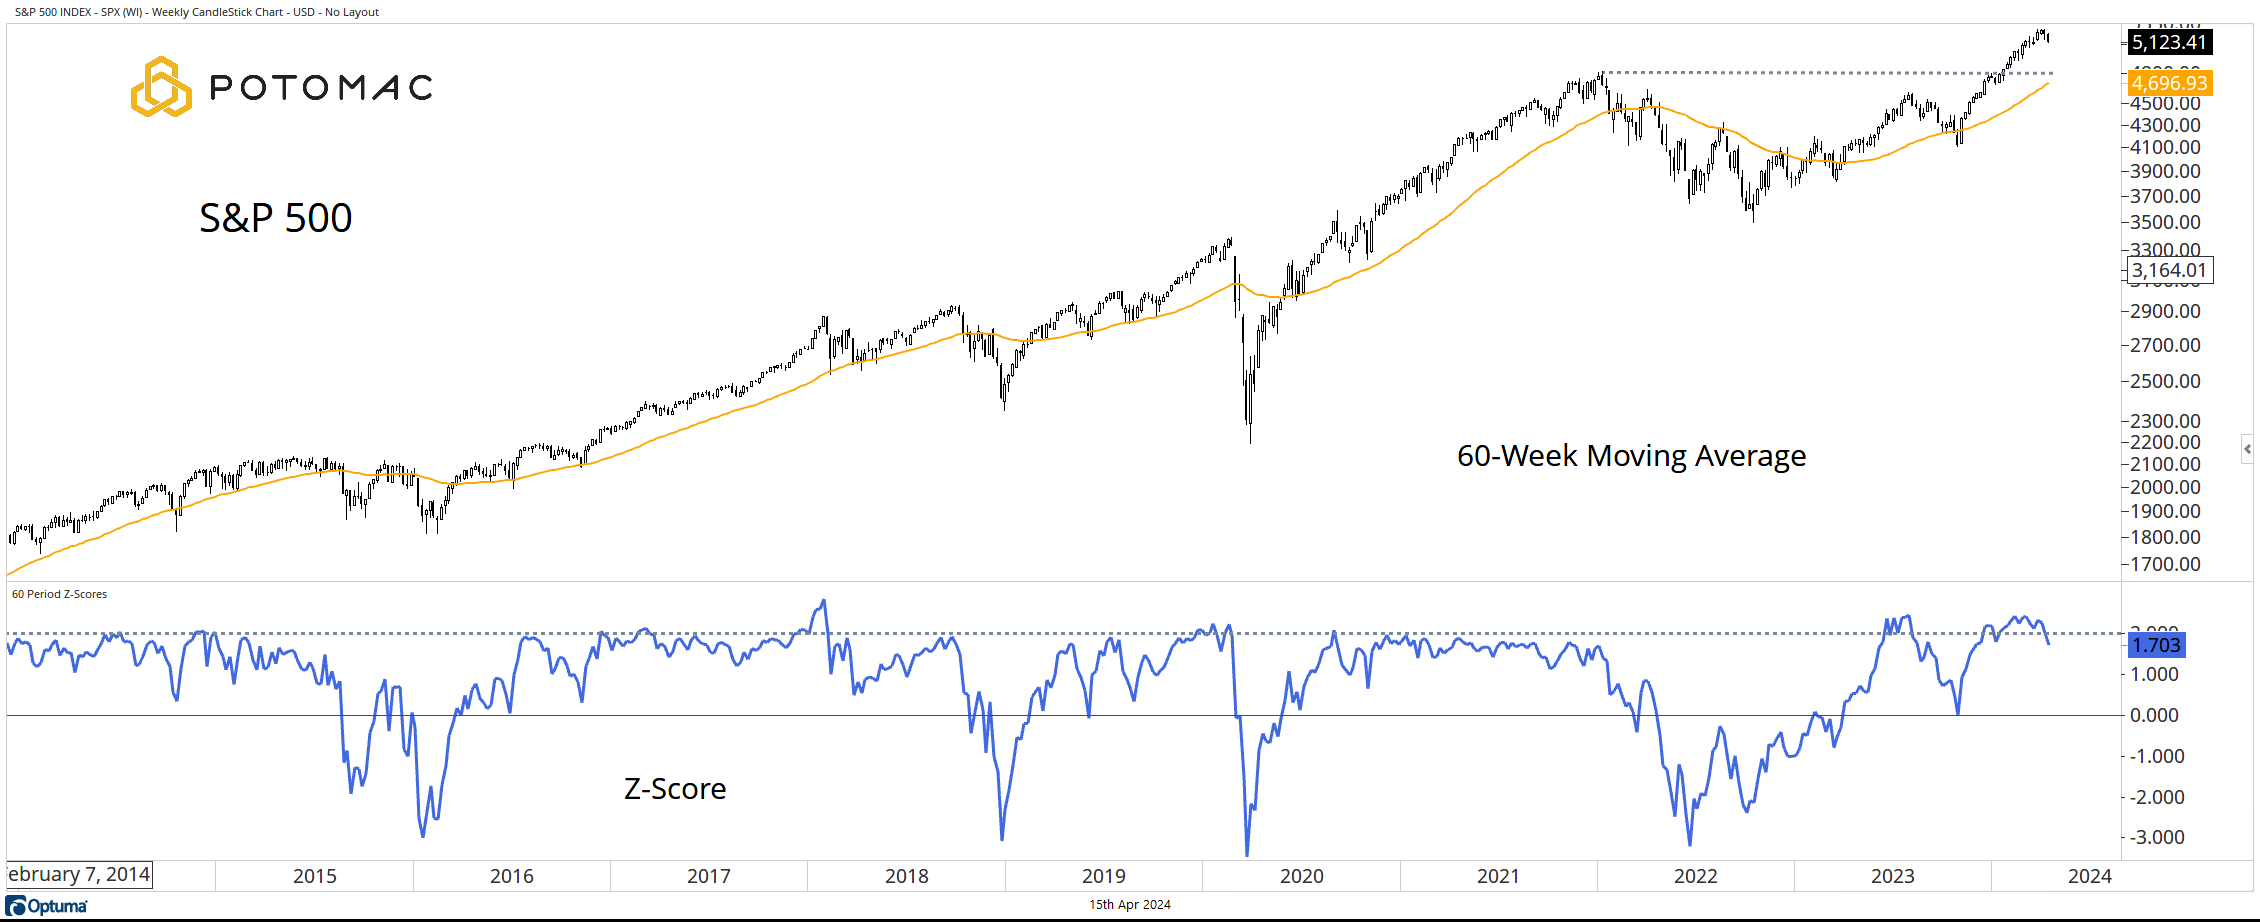
S&P 500
Despite back-to-back weekly declines, the S&P 500 remains near all-time highs, well above the rising 60-week moving average. In the past, we have made the case that the index was extended, trading more than two standard deviations above the 60-week moving average. Recent price weakness has alleviated that extended position, but there is room for the index to fall toward support and the moving average.
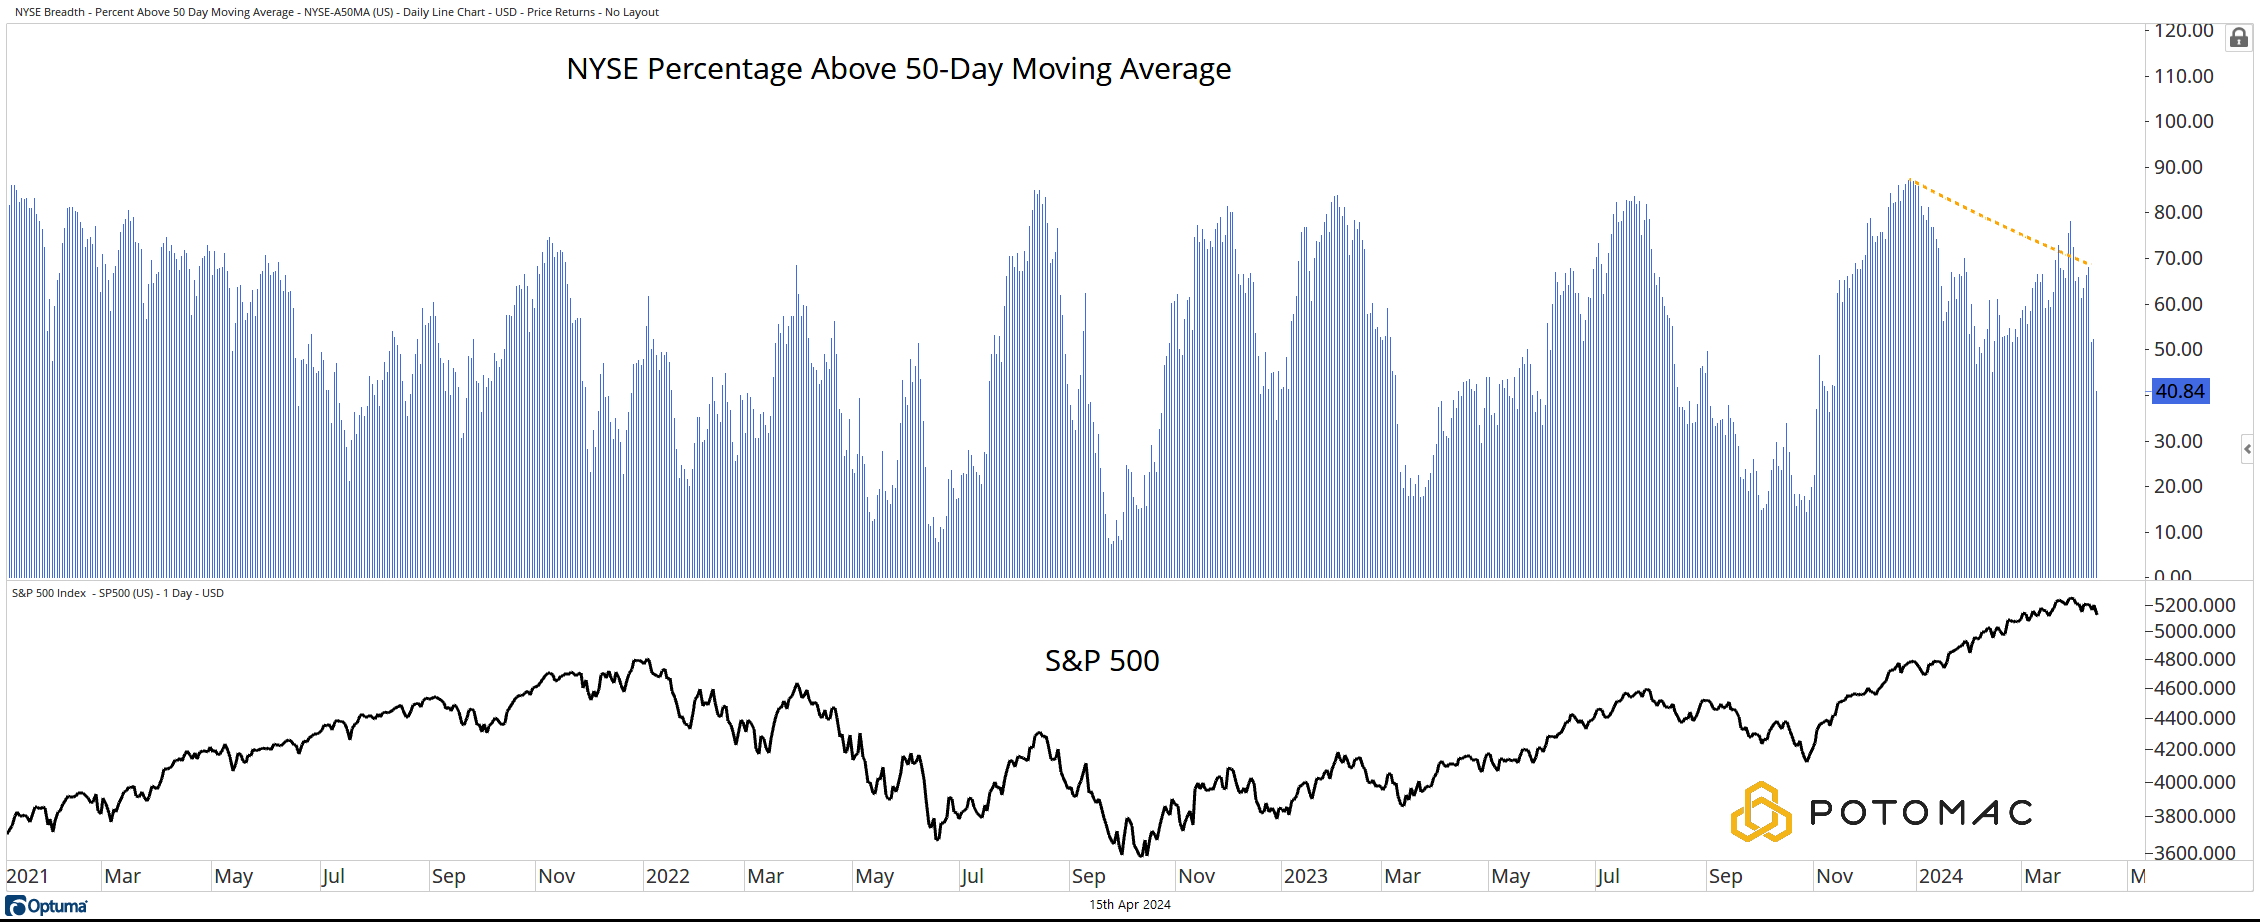
NYSE Percent Above the 50-Day Moving Average
The percentage of stocks on the NYSE trading above their respective 50-day moving averages has been making a lower high since November, creating a divergence between this indicator and the S&P 500.
Of note, the current reading is now below the 50% level.
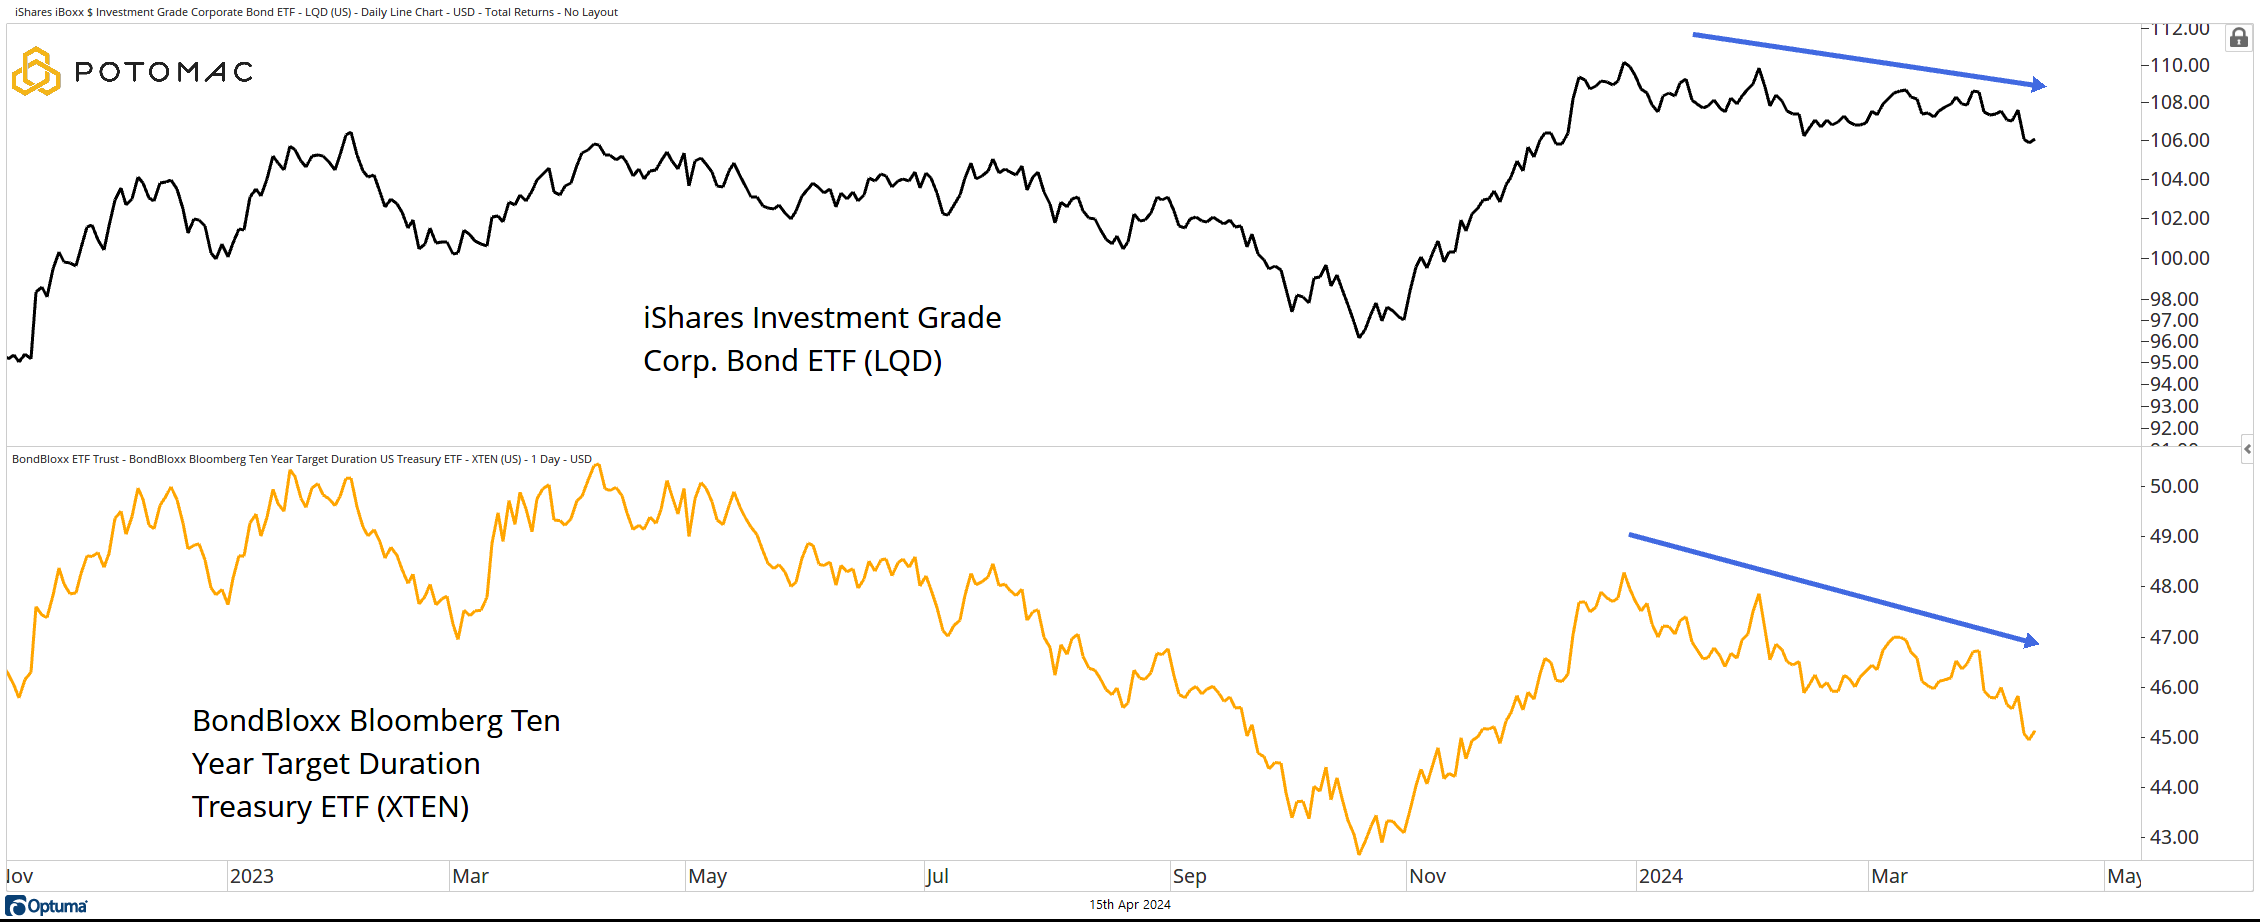
The Bonds
Bonds continue to diverge with equities. This theme is one that has kept out model cautious for much of 2024. Both Investment Grade Corporate and the 10-Year Treasury Bonds have been trading lower since the start of the year.
We have done much work on the fact that long-term stock/bond correlations have turned positive. For those who believe that the bond market is smart, there is a message in this price action.
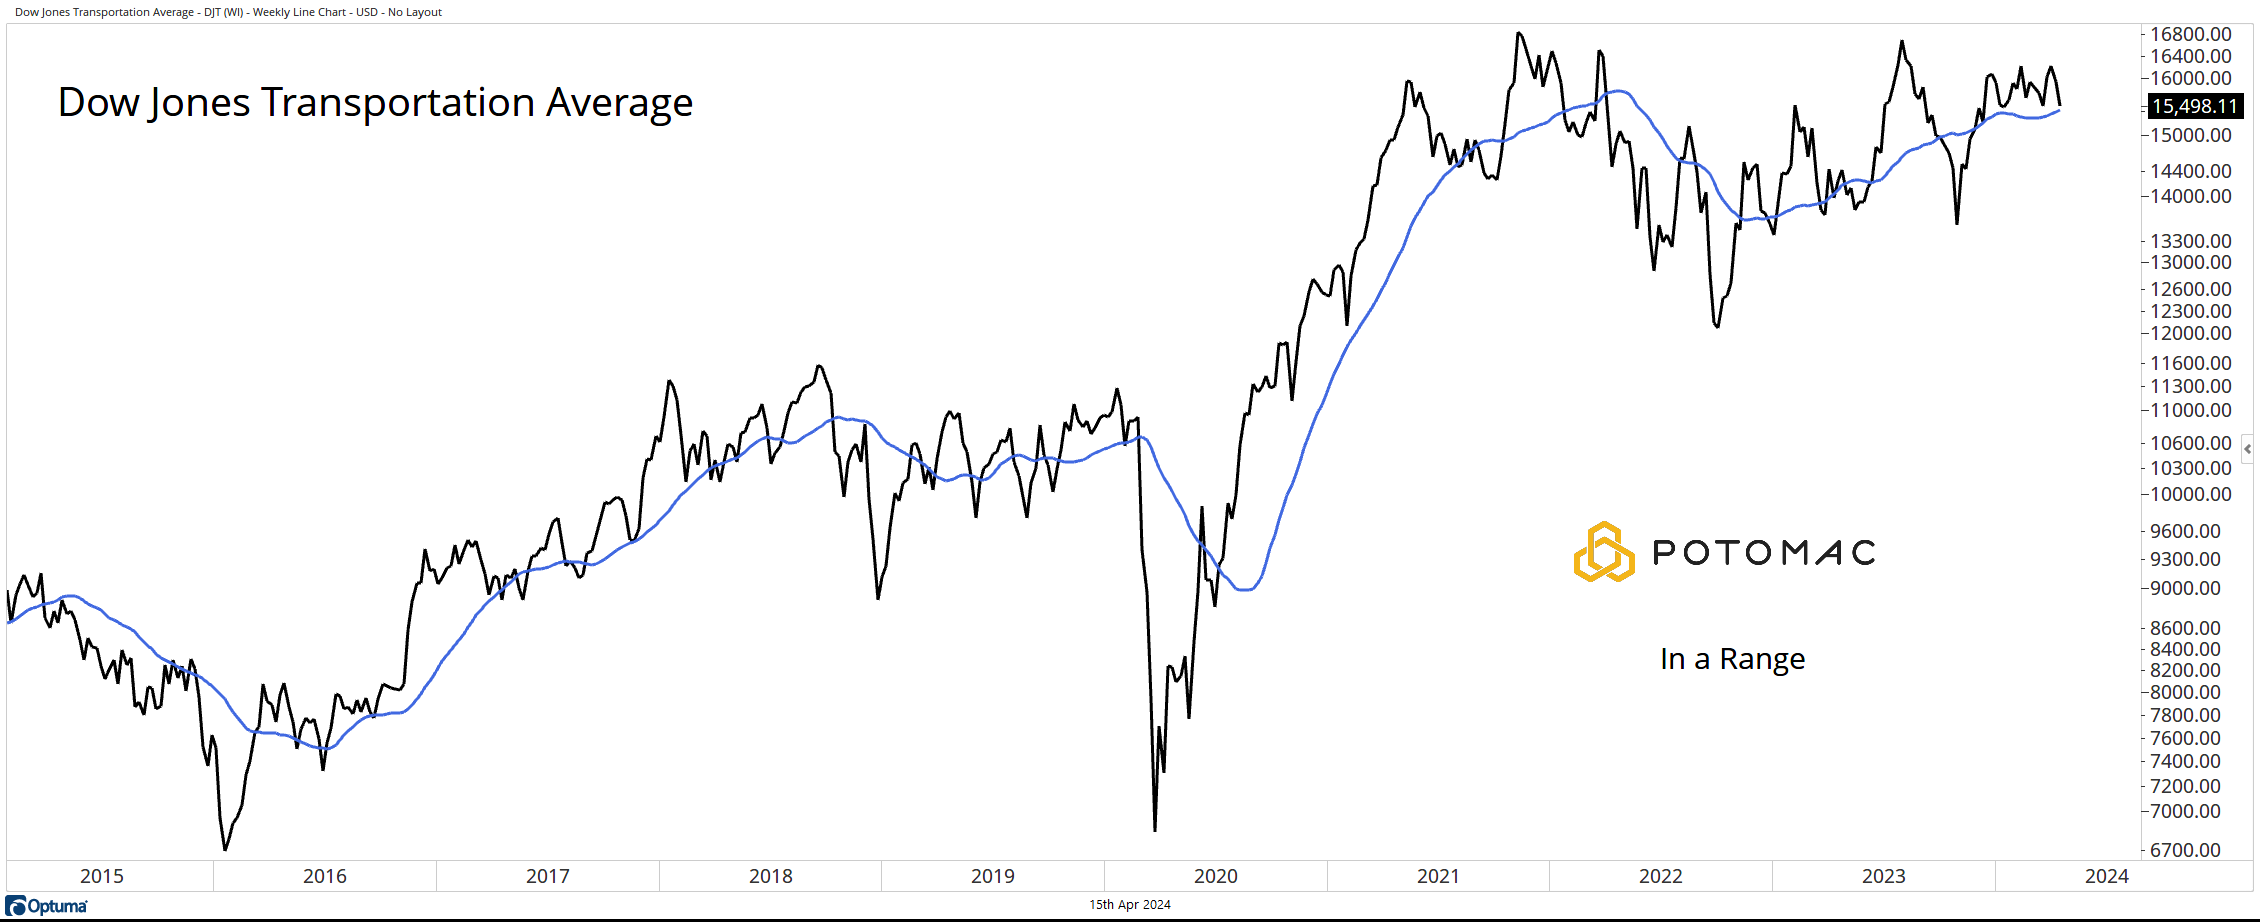
Dow Jones Transportation Average
While we can’t make an outright bearish case on the transports (They are above their 27-week moving average), we can note that they have not made a new high with the S&P 500, the Dow Jones Industrial Average, or the NASDAQ 100 in 2024 (see our note from April 1st).
The Transports have been in a range for nearly three years.
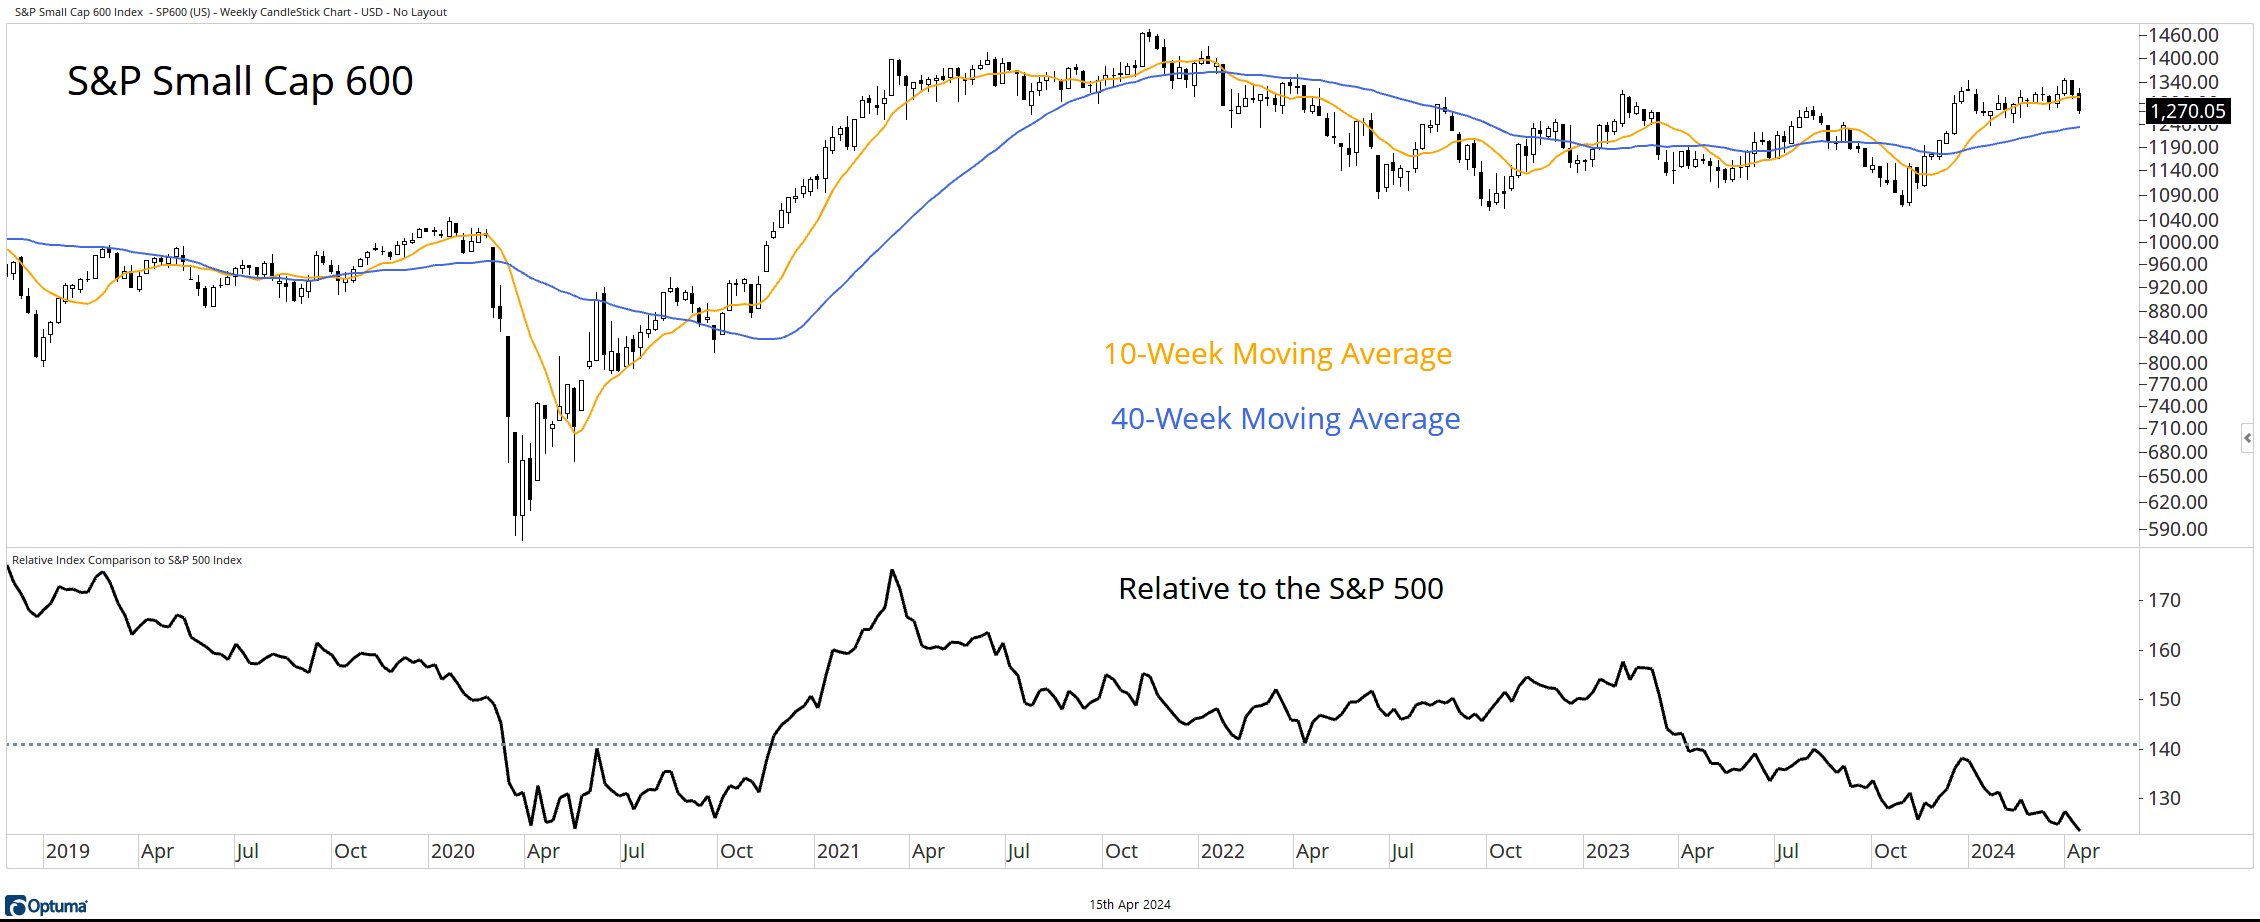
Small Caps
Small Cap stocks are usually measured by the Russell 2000, but I do not believe that it is fair to measure the Russell against the S&P 500. There are so many low-quality companies in the Russell that are not likely ever to amount to anything. The S&P 600 Index is a stronger representation of small caps, in my opinion.
Here we see an index that has not made new highs, is trading below the 10-week moving average (but above the 40-week) and is trading at relative lows near 2020 COVID levels.
*All Charts are from Optuma as of 4/14/2023. Past performance does not guarantee future results.
Disclosure: This information is prepared for general information only and should not be considered as individual investment advice nor as a solicitation to buy or offer to sell any securities. This material does not constitute any representation as to the suitability or appropriateness of any investment advisory program or security. Please visit our FULL DISCLOSURE page.
PFM-319-20240415