

As the S&P 500 trades to new all-time highs and the much-hated Russell 2000 trades to new 52-week highs, all anyone wants to talk about this weekend is the cover of Barron’s magazine.
The thought process is that when the journalists are bullish, it is a contrarian indicator. However, I cannot find anyone who has taken the time to test this concept.
I am not even sure how you might go about that process. Which magazines should be included? What type of headline constitutes a call that can be faded?
To those who are bearish because of this cover, I point you to the title of today’s note. For others, my recollection tells me that the “magazine cover indicator” had more to do with non-business magazines such as Time Magazine.
This is not to say that sentiment is not bullish; it is. It is more to point out that without doing the testing, you can’t separate signals from noise.
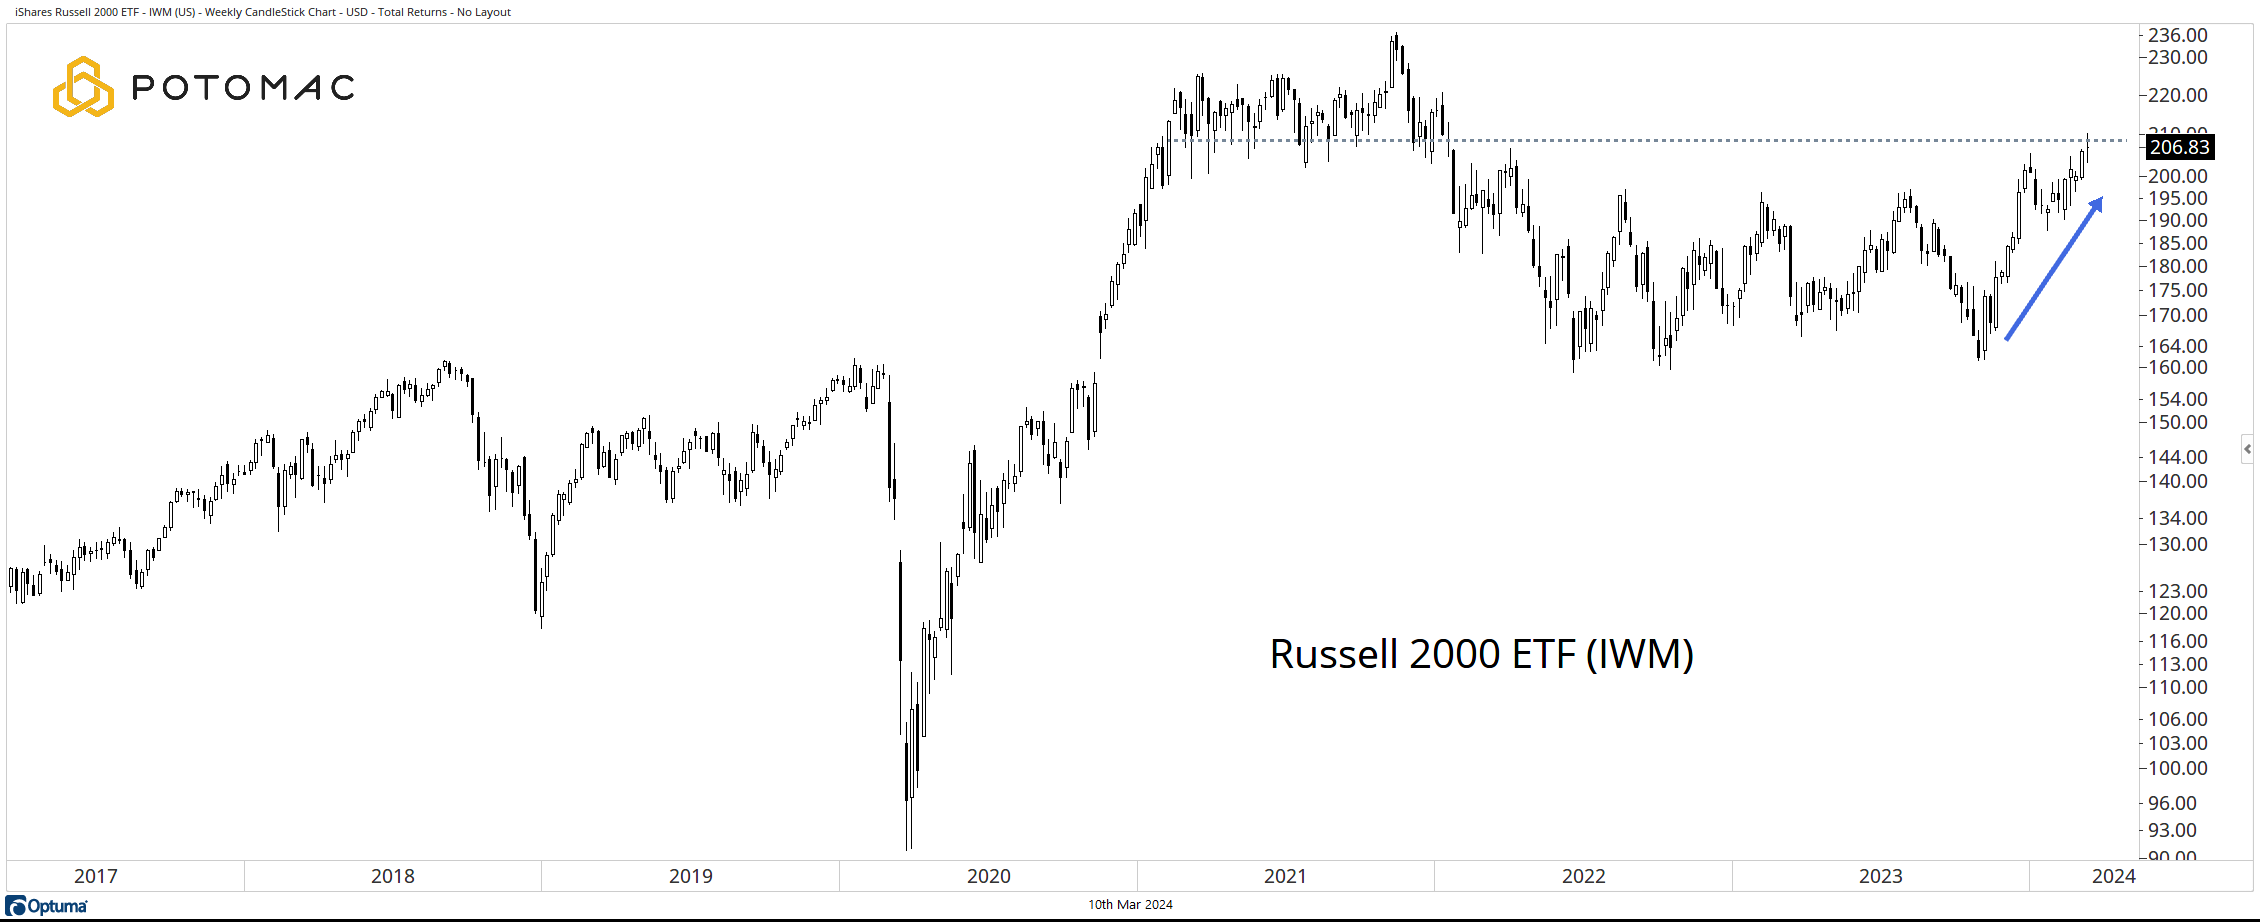
Russell 2000
The weekly chart of the iShares Russell 2000 ETF (IWM) traded to a new 52-week high last week before fading to close in the middle of the weekly range. The move has made a strong move from the October lows, and sustained strength is a sign that the market rally is broadening away from the Mag 7 and other Technology leaders. A close above $210 strengthens this view.
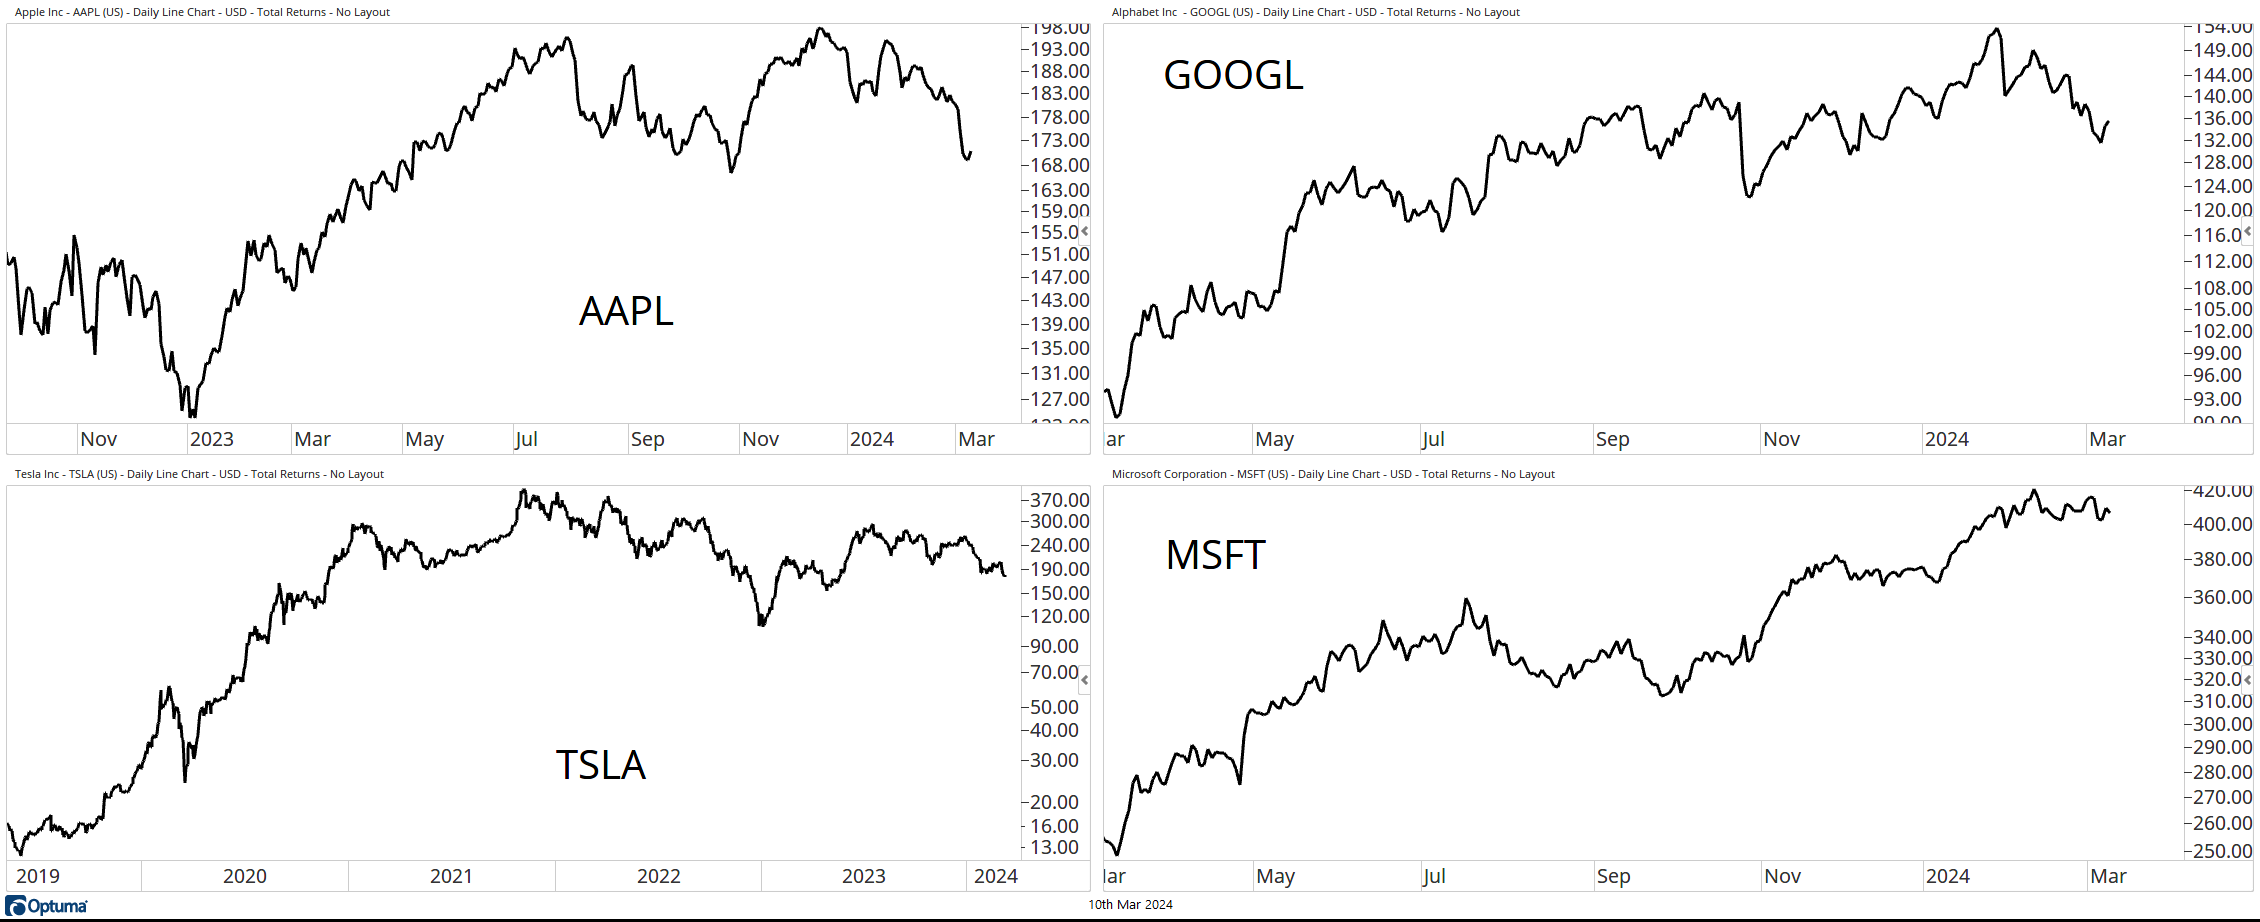
Should it be the Mag 3?
It is interesting to note that four of the Mag 7 topped a month (Microsoft Inc., MSFT) or more ago. In fact, Tesla Inc. (TSLA) peaked more than two years ago. To be fair, MSFT is still in an uptrend, but it has not been running away for the past month, as some would have you believe.
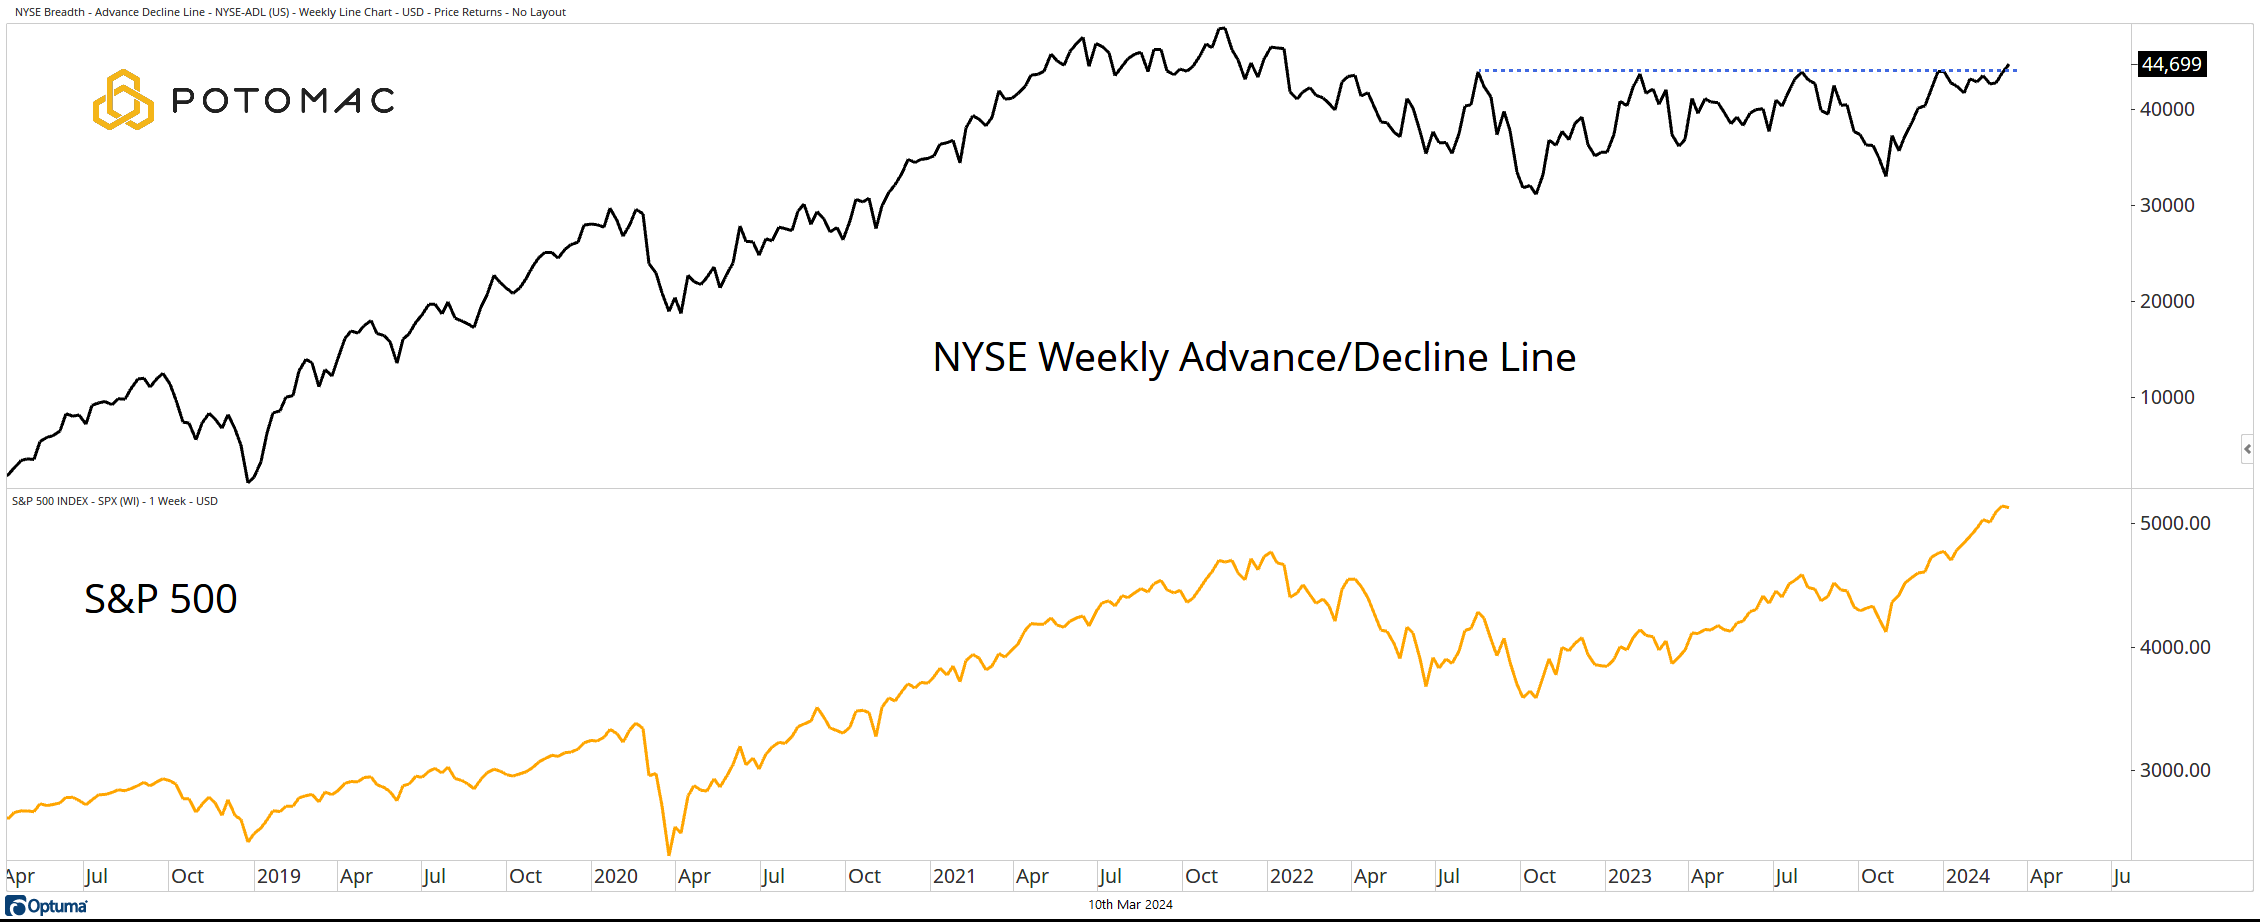
NYSE Advance/Decline Line
While four of the Mag 7 waver, the NYSE Advance/Decline Line is in the process of breaking from a consolidation. A divergence remains in place, but this is an incremental improvement in market breadth.
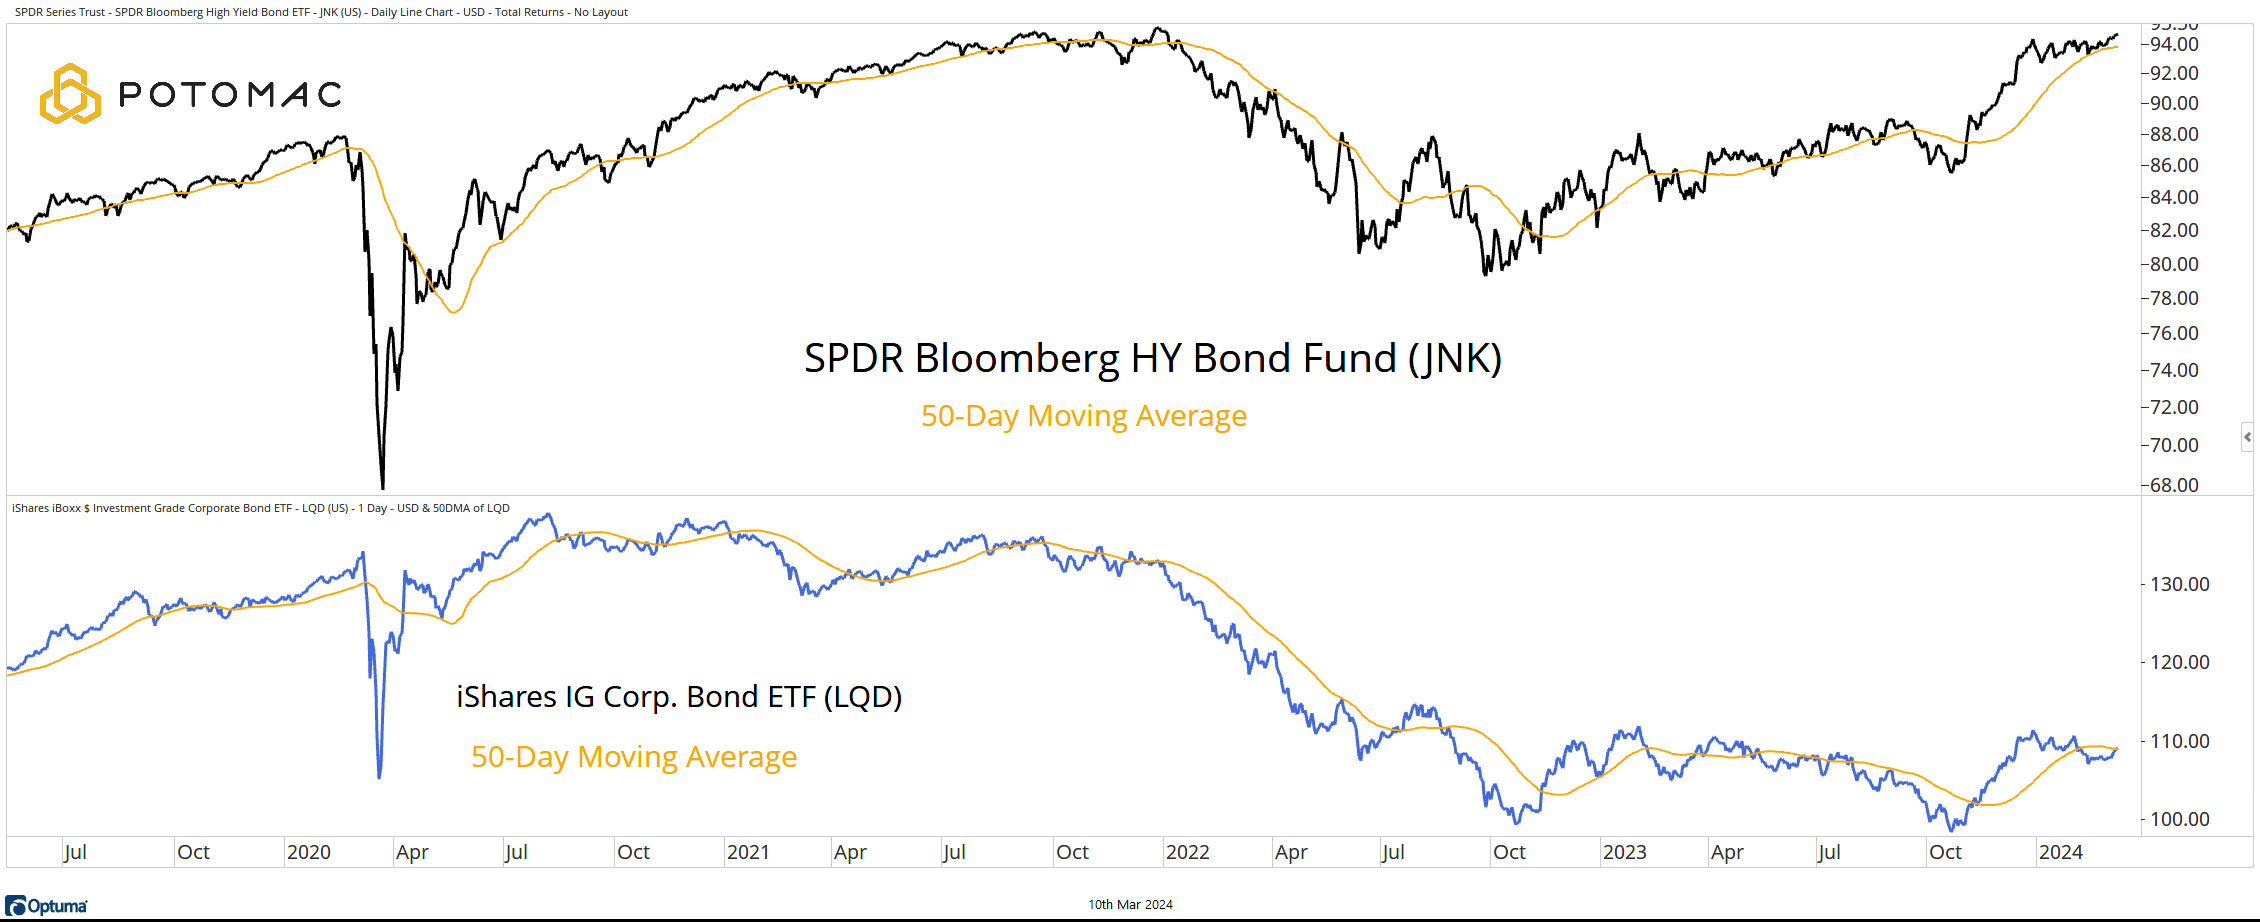
The Bonds
While this chart is a repeat from last week, it is here for a reason. There is an important change taking place.
We have noted that High-Yield bonds have been strong while their Investment-Grade cousins have not. That appears to be changing. The IG bonds are in the process of regaining their 50-day moving average.
Given the change in correlations that we have noted for nearly two years, continued strength in the bond market could be a positive for equities.
*All charts from Optuma as of the close of trading on March 8, 2024. Past performance does not guarantee future results.
Potomac Fund Management ("Company") is an SEC-registered investment adviser. This information is prepared for general information only and should not be considered as individual investment advice nor as a solicitation to buy or offer to sell any securities. This material does not constitute any representation as to the suitability or appropriateness of any investment advisory program or security. Please visit our FULL DISCLOSURE page. The company does not make any representations or warranties as to the accuracy, timeliness, suitability, completeness, or relevance of any information prepared by any unaffiliated third party, whether linked to the Company website or incorporated herein, and takes no responsibility for any of this information. The views of the Company are subject to change and the Company is under no obligation to notify you of any changes. Different types of investments involve varying degrees of risk, and there can be no assurance that the future performance of any specific investment or investment strategy will be profitable or equal to any historical performance level.
PFM-310-20240311