

In my experience, the biggest disagreements in markets, between bulls and bears, are usually a function of timeframe. A “trader” may have a bearish view of the market over the next week or two, and if that trader is speaking with an “investor” who has a much longer timeframe, they will likely disagree. They can both aggressively argue their points, and the kicker is they can both be right.
Is the short-term structure of the market tilting to the bearish side? Absolutely.
Is the long-term trend in the market still bullish? Absolutely.
Both can be true. Both are true, in my opinion.
S&P 500
The main chart depicts the intermediate/long-term trend of the S&P 500, the one that drives much of our work at Potomac. The index has logged two weekly declines in a row but remains in a bullish trend above the rising 60-week moving average.
The smaller chart is the daily version of the S&P 500. After making a new high on February 19, the index saw six consecutive days where the close was lower than the open before reversing that ominous trend on Friday.
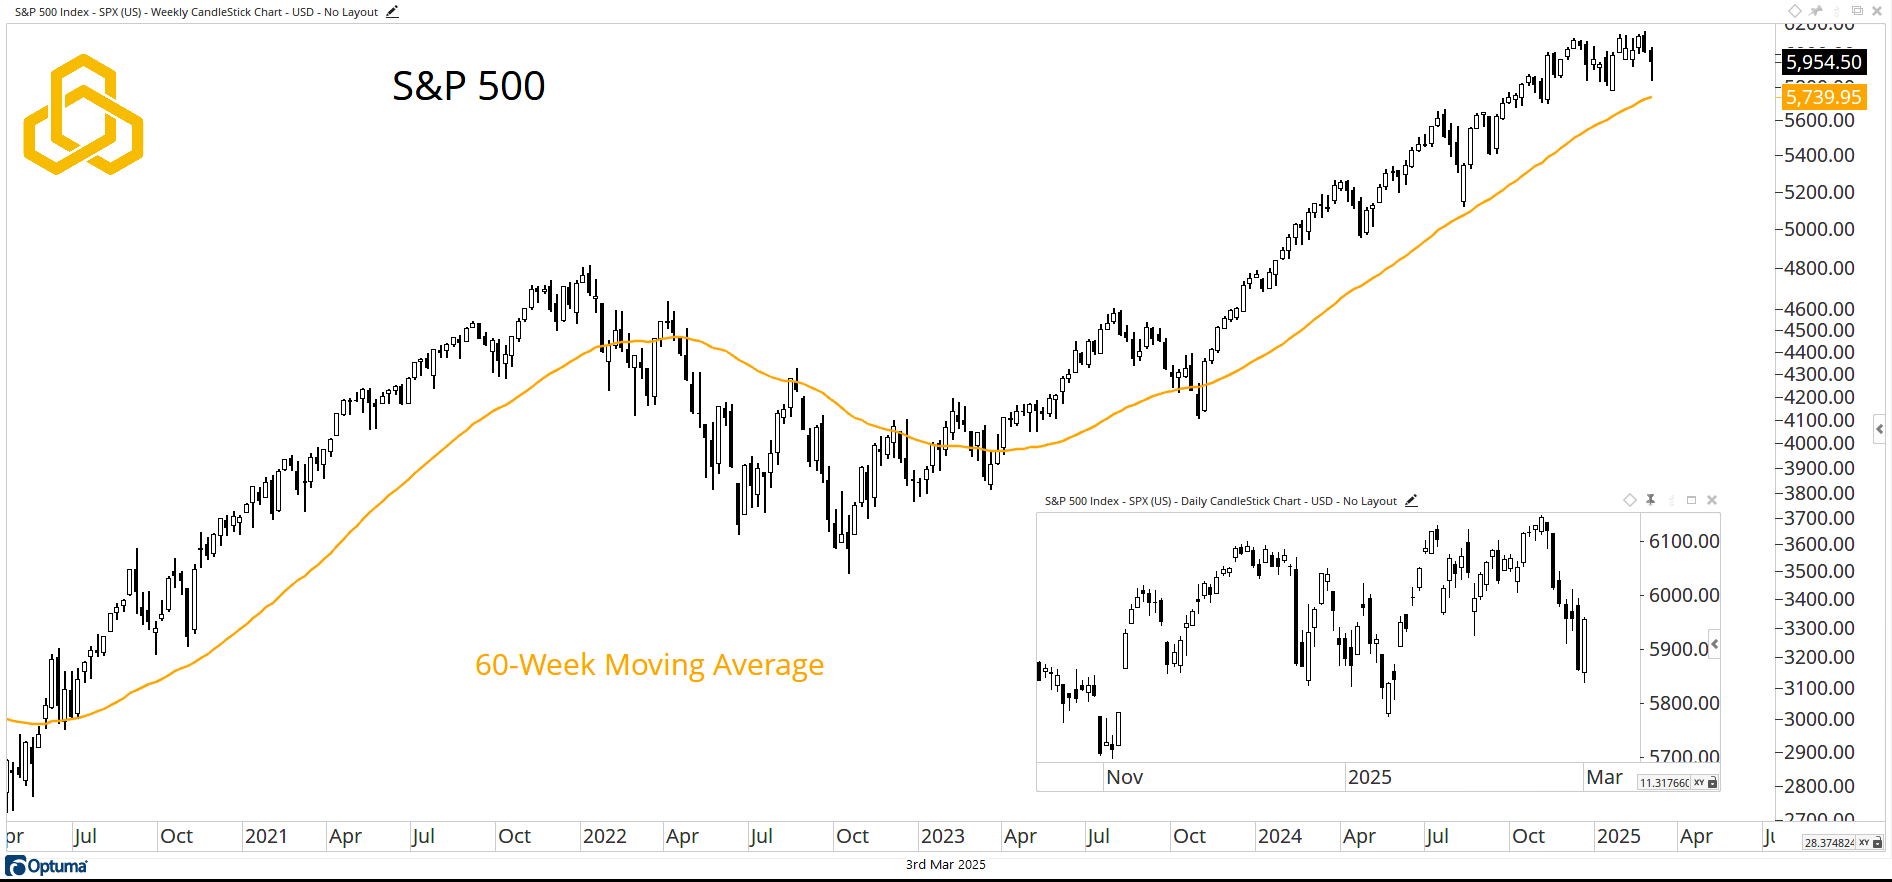
Source: Optuma
NYSE Advance/Decline Line
Breadth remains a concern, not a sell signal, but a concern. The NYSE Advance/Decline Line remains in a divergence, having failed to confirm the S&P 500’s February 19 high. At the same time, the one-year stochastic remains below 80%.
A break to a new high for this indicator would alleviate much of the short-term bear thesis.
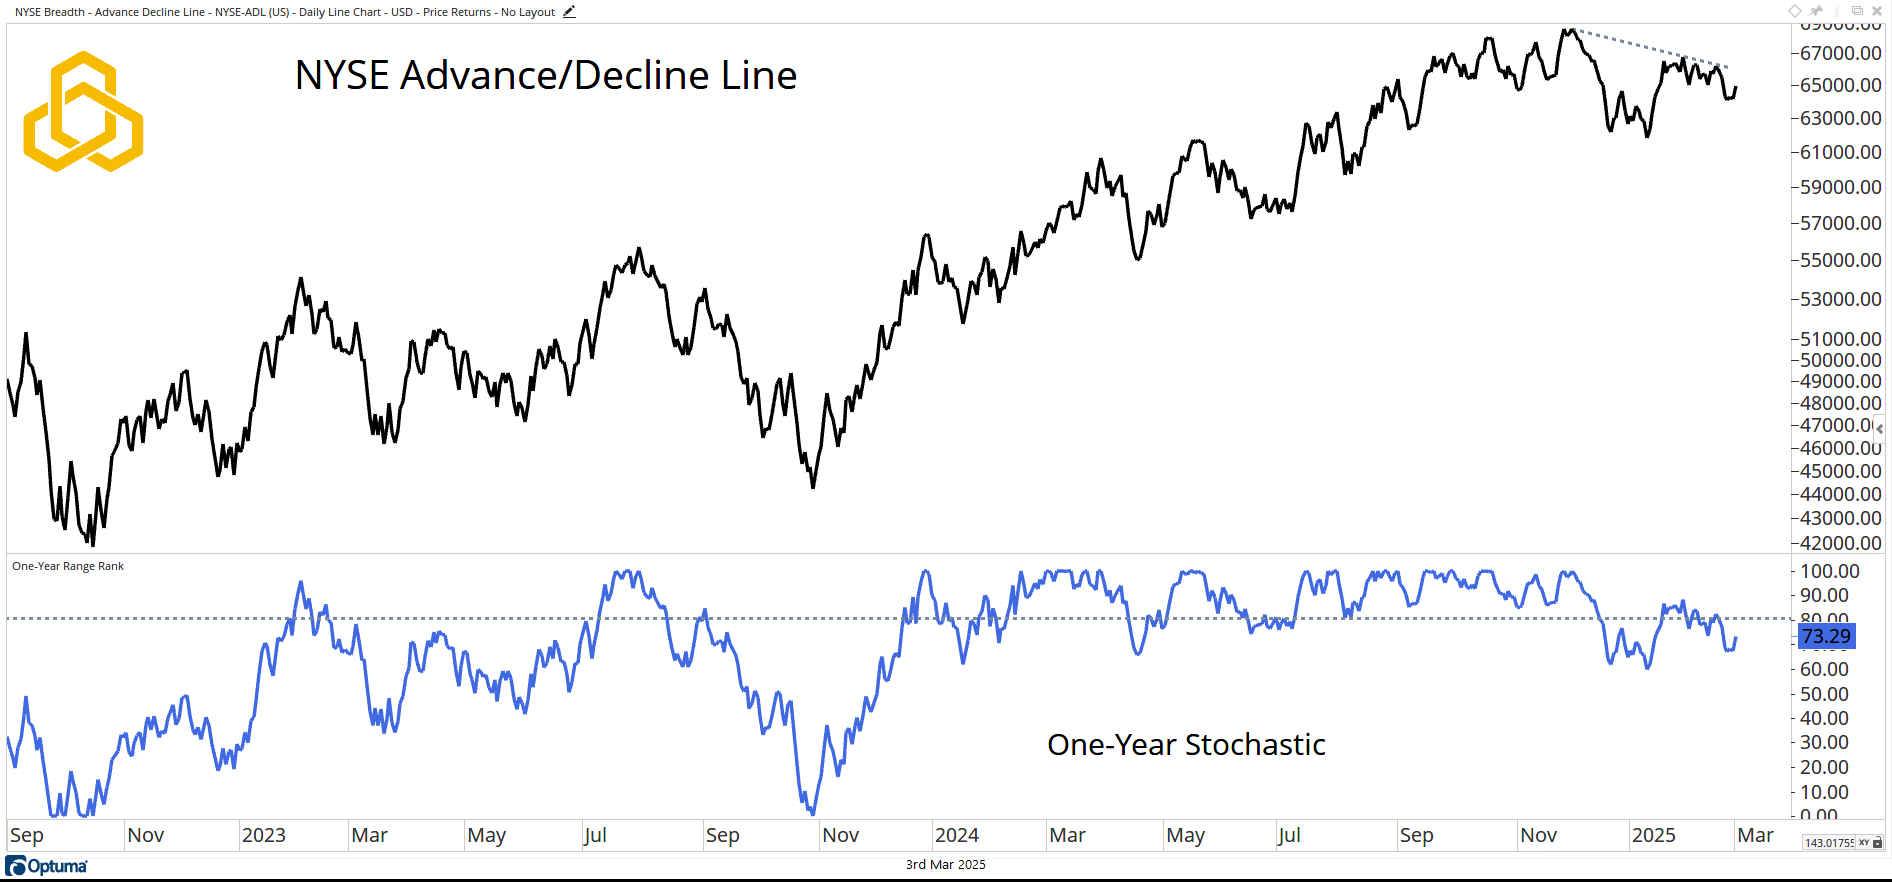
Source: Optuma
Monthly Seasonality
Perhaps the turn of the calendar is just what the bull case needs. February lived up to its reputation as a bearish month for the S&P 500 (based on data back to 1950). However, March and April have tended to be strong months.
Monthly seasonals, in isolation, are not a reason to act. However, the possible tailwind they can provide is worth noting here on the first trading day of March.
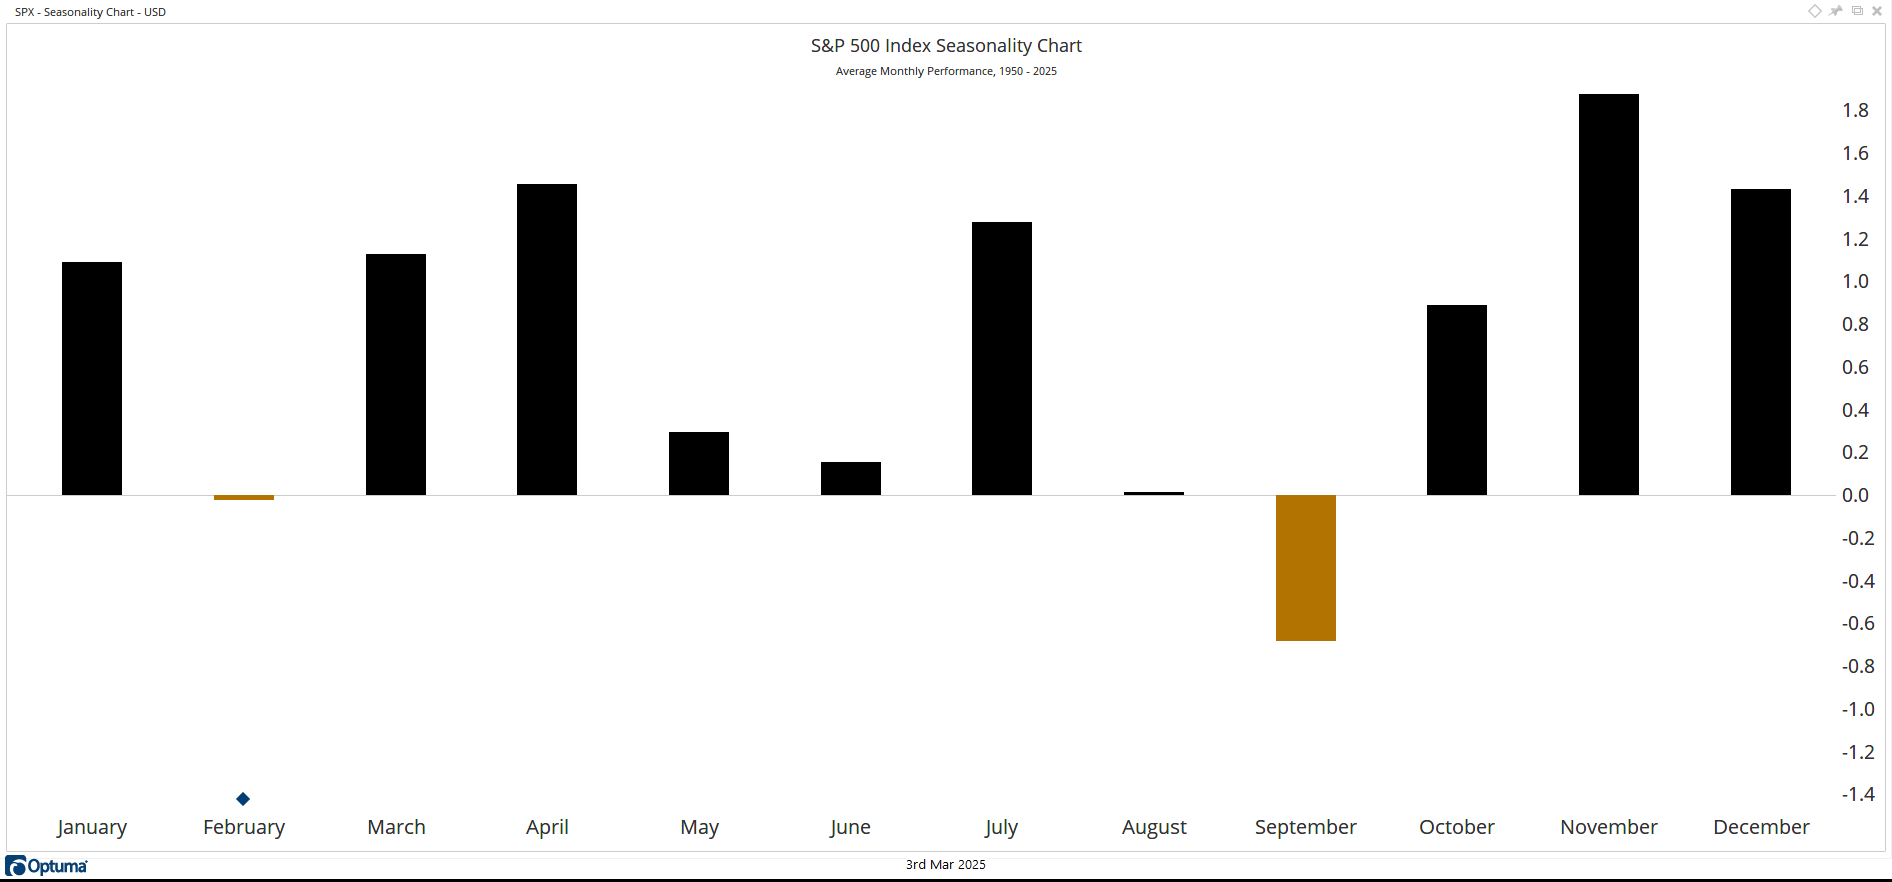
Source: Optuma
The 10-Year Note
Finally, the 10-Year Treasury Note appears to be working through a bottoming process. Why do we care? Recall that we have been extremely vocal since 2022 about the shift in stock/bond correlation from being negative for 22 years to being positive due to a shift in the inflation regime.
With the Consumer Price Index hovering near 3%, we consider the regime to be inflationary and therefore, the odds favor a continued positive correlation. A move higher in Treasuries could be bullish for equity prices.
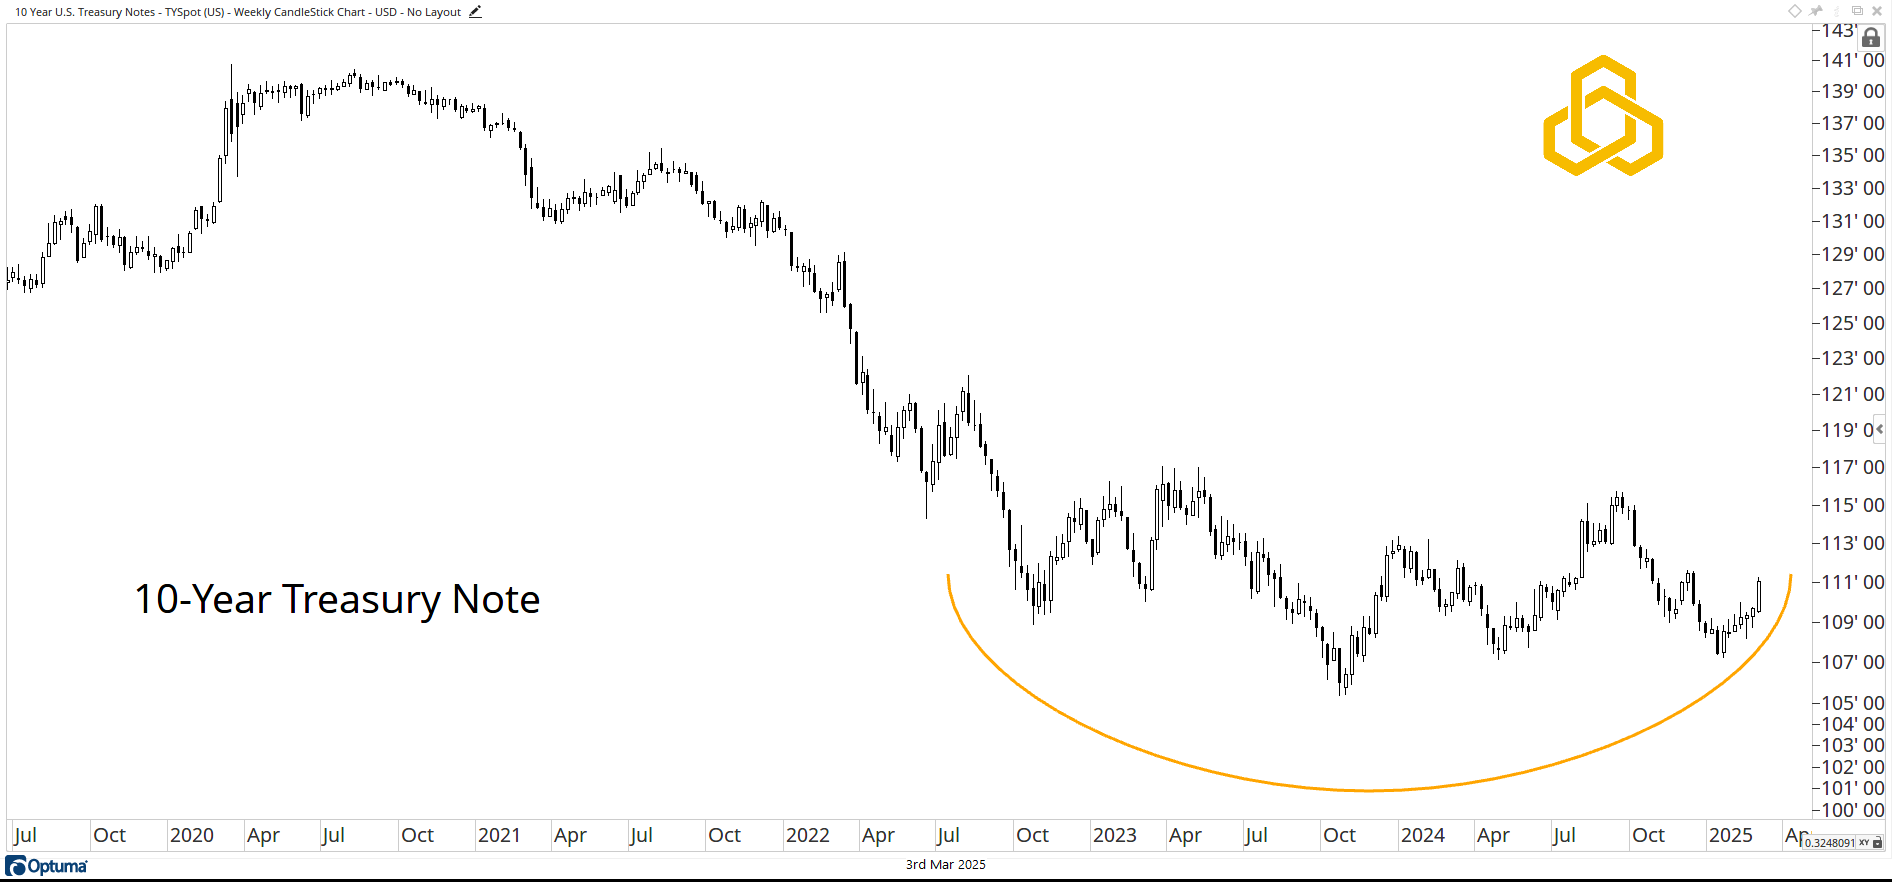
Source: Optuma
Disclosure: This information is prepared for general information only and should not be considered as individual investment advice nor as a solicitation to buy or offer to sell any securities. This material does not constitute any representation as to the suitability or appropriateness of any investment advisory program or security. Please visit our FULL DISCLOSURE page.
PFM-303-20250303