

As the S&P 500 enters the final two trading days of the year, both bullish and bearish cases can be made. Undoubtedly, many will attempt to predict how 2025 will unfold. We are not those people. We do not claim the arrogance of being able to see the future.
What we will do is share what we observe now and how we think it impacts the market’s trend. I will also highlight what I consider the key chart for 2025—a chart you’ve seen before.
S&P 500
It’s hard to call this chart bearish in any way, shape, or form. The key U.S. index remains solidly above a steadily rising 60-week moving average.
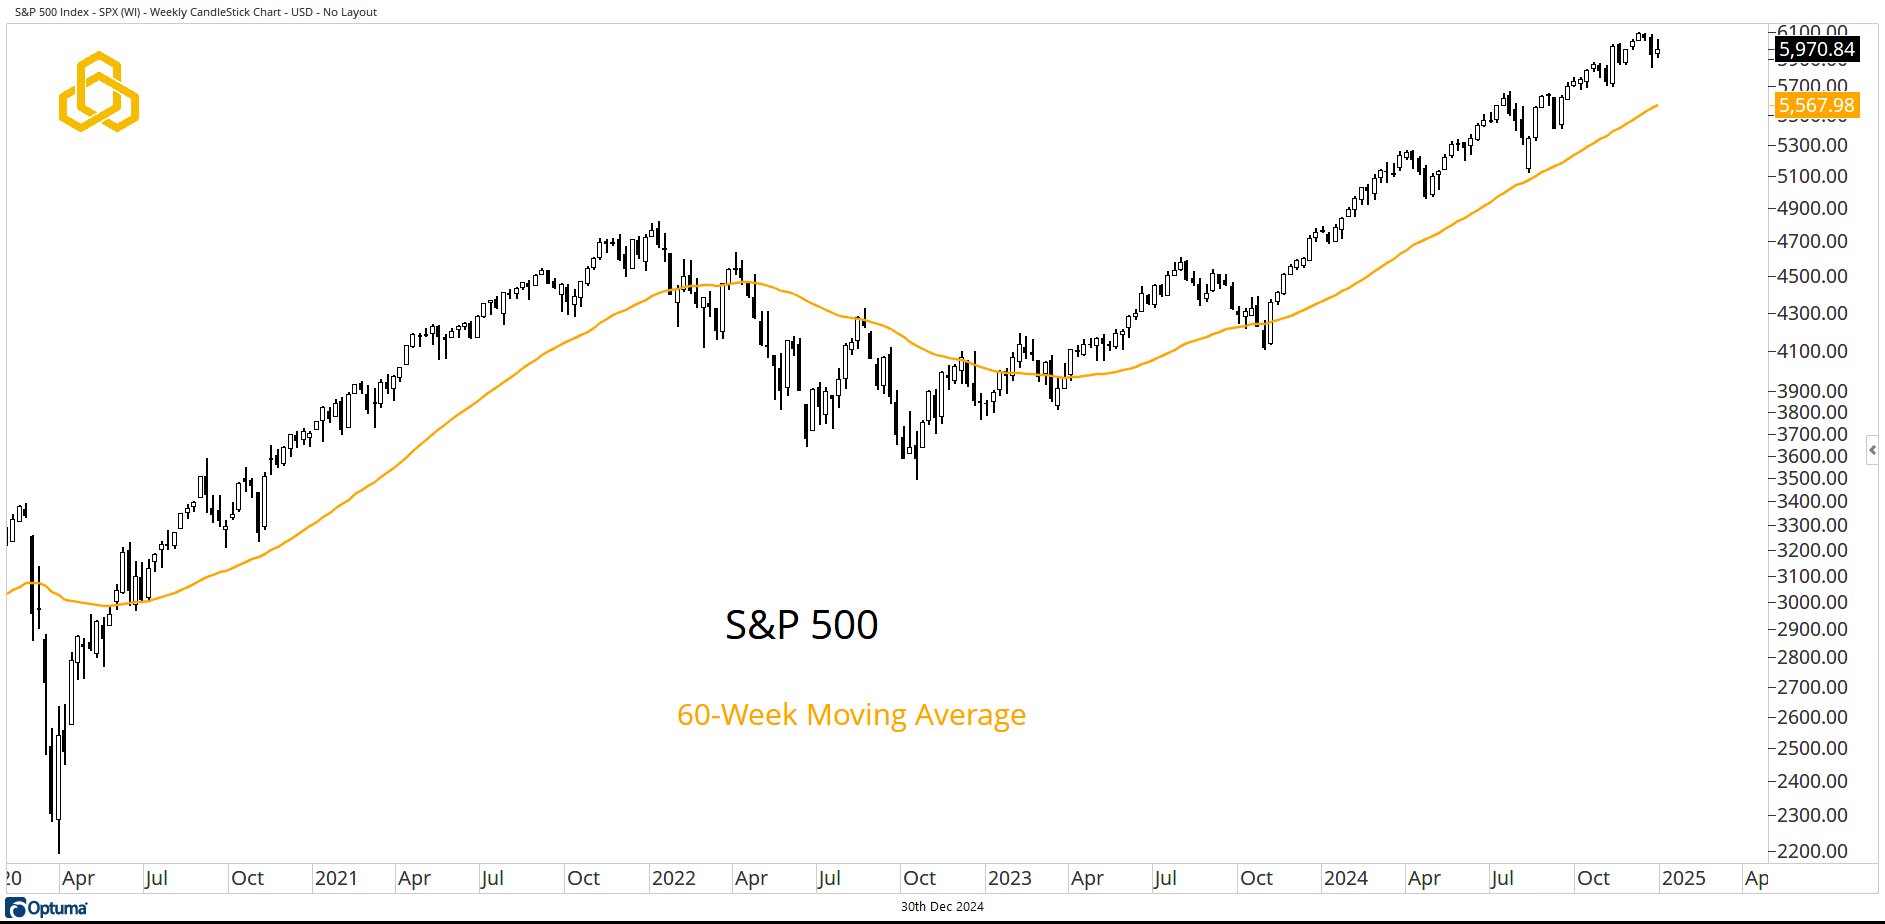
Source: Optuma
S&P 500 Sector Returns
For 2024, only one S&P 500 sector ETF (we’re looking at you, Materials) is not above the zero line. Of the eleven sectors, only three—Communication Services, Financials, and Discretionary—are outperforming the impressive 25.18% year-to-date return of the S&P 500 ETF.
Zooming in on the past three months, however, seven of the eleven sectors have declined (referencing last week’s note on weakening breadth). Bears are quick to point out this waning upside participation.
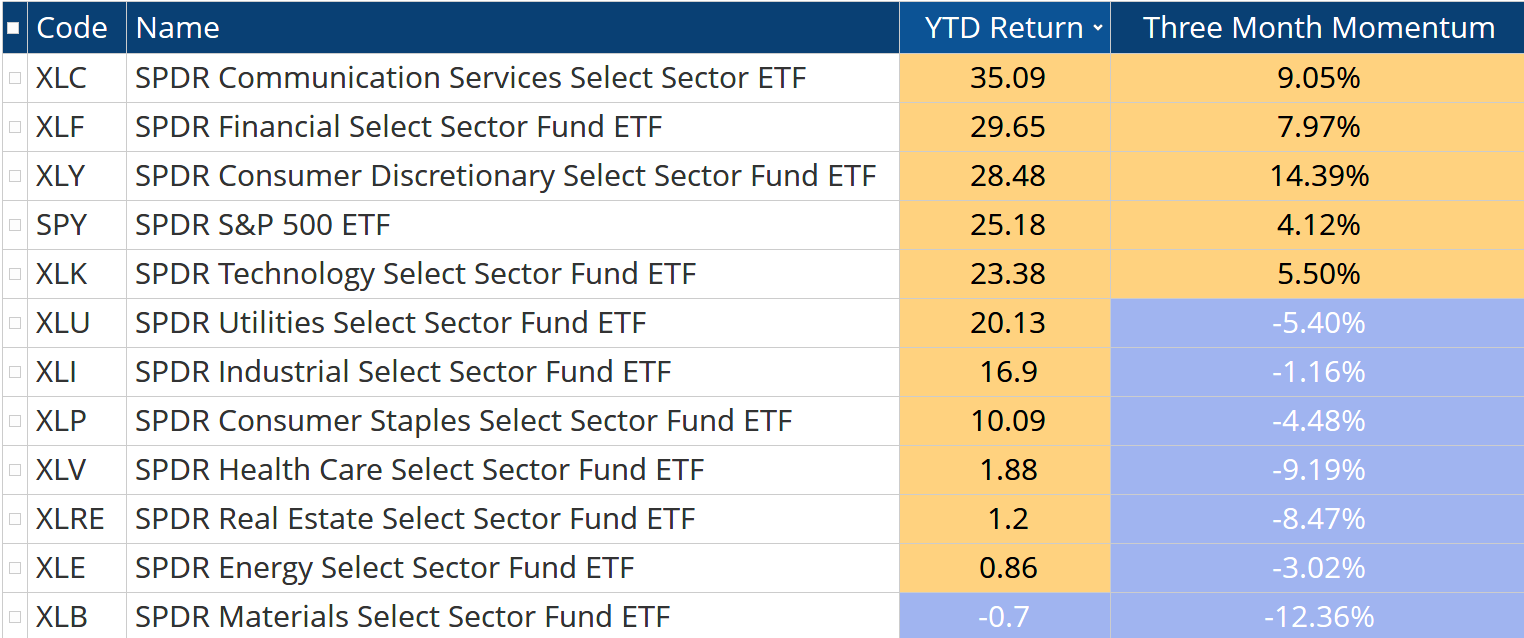
Source: Optuma
Equal Weight vs. Cap Weight
Not only are fewer stocks and sectors advancing, but leadership is becoming increasingly concentrated in the market’s largest names. The ratio of the S&P 500 Equal Weight ETF to the S&P 500 Cap Weight ETF continues to test recent lows below a declining 200-day moving average.
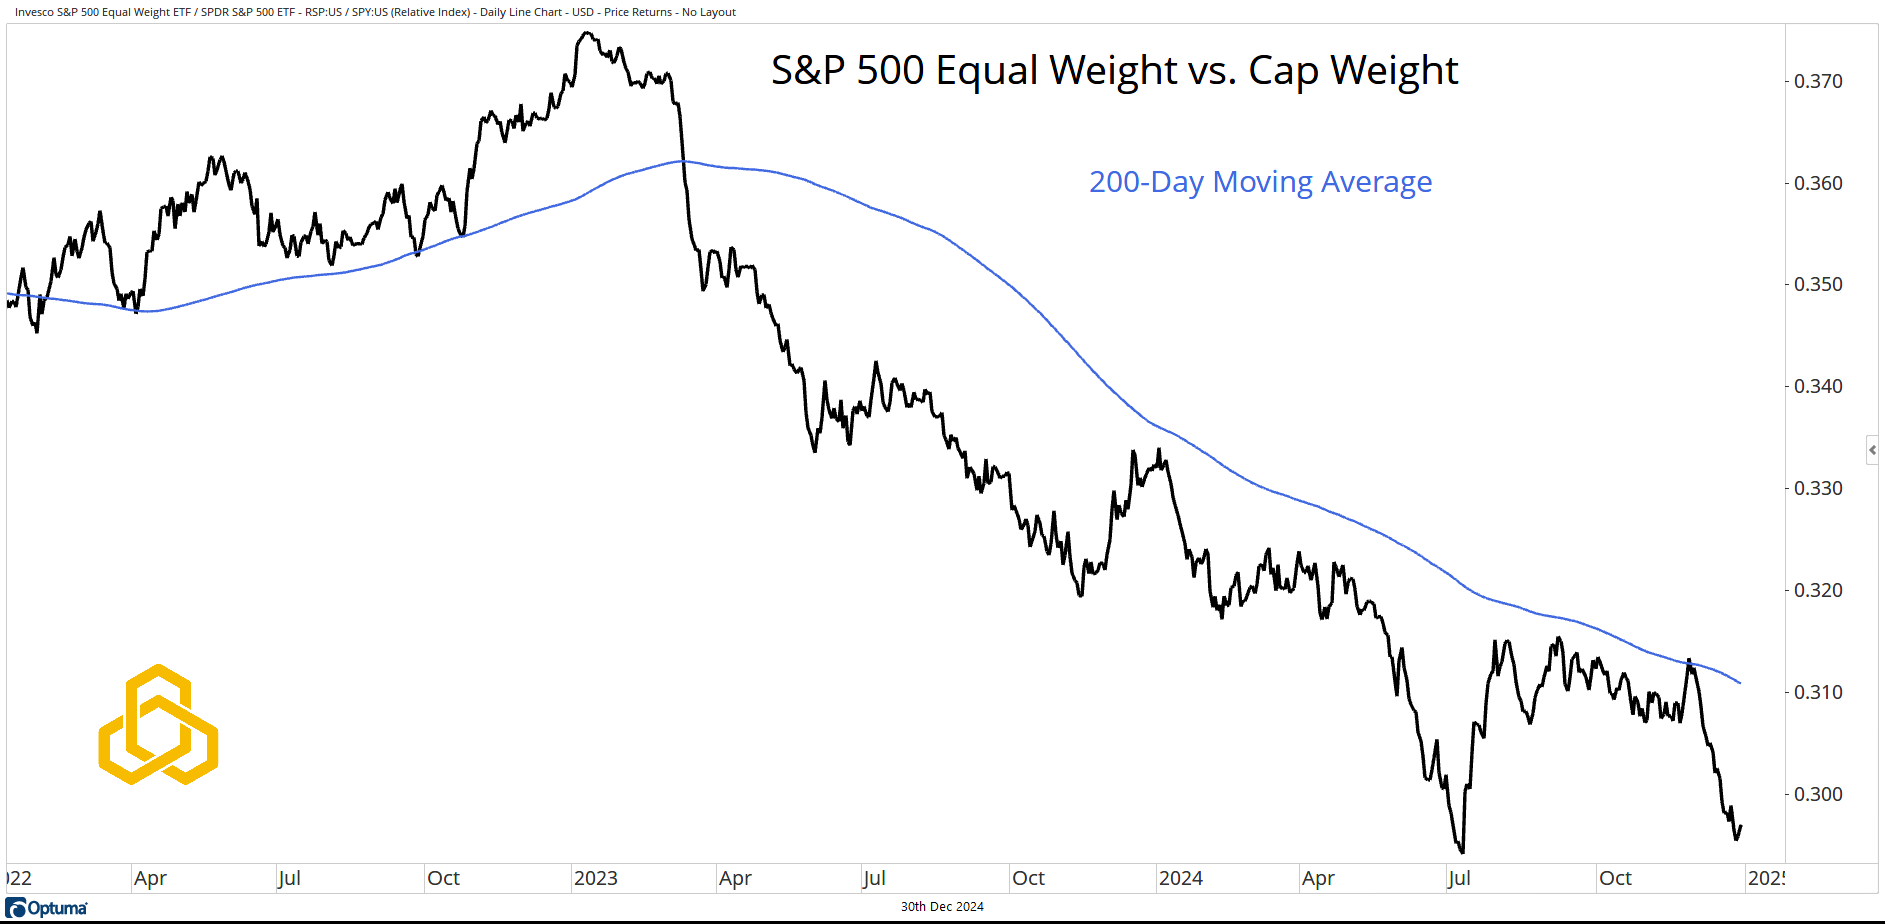
Source: Optuma
While the trend in the S&P 500 remains bullish, this declining breadth and the concentration of performance in top-tier stocks pose risks as we move into 2025. Investors who “just own SPY” may not yet see the problem, but these signals warrant attention.
The Most Important Chart for 2025
Anyone paying attention has noticed that market-based interest rates are rising, even as the Federal Reserve embarks on a rate-cutting cycle. This suggests that the bond market believes inflation is not fully under control and is unlikely to return to the 2% CPI target anytime soon.
If the bond market is correct and inflation ticks higher, this Stock-Bond Correlation Chart becomes critical. Historically, as CPI rises above 3%, the likelihood of stocks and bonds moving in tandem increases—a dynamic that could complicate portfolio diversification strategies.
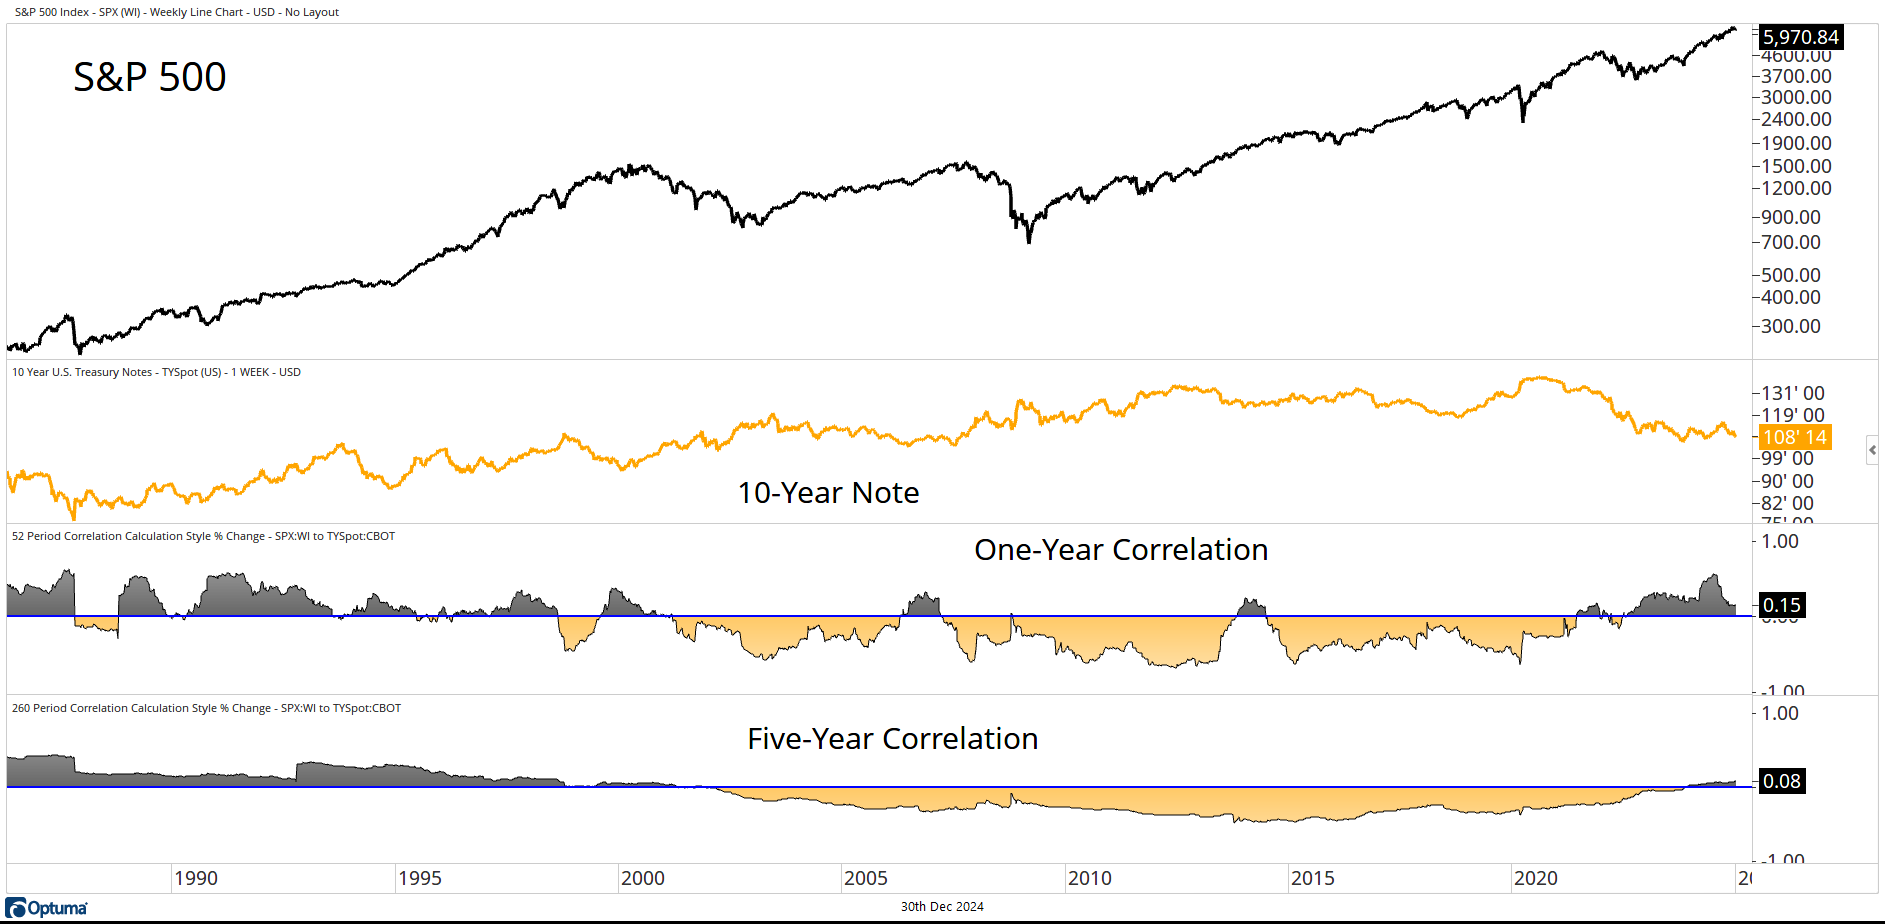
Source: Optuma
Thank you for taking the time to read my work each week. Have a Happy and Safe New Year.
Disclosure: This information is prepared for general information only and should not be considered as individual investment advice nor as a solicitation to buy or offer to sell any securities. This material does not constitute any representation as to the suitability or appropriateness of any investment advisory program or security. Please visit our FULL DISCLOSURE page.
PFM-380-20241230