

I would be lying if I said that we were not paying attention to it as well, but the bad breadth bear case just lost a lot of its merit. Last week saw a massive improvement in the underlying health of the market.
Rest assured, permabears will take part in what is known as thesis shift to maintain their bearish view, but those who are either open minded and intellectually honest or those who are systematic will recognize the importance of last week’s action.
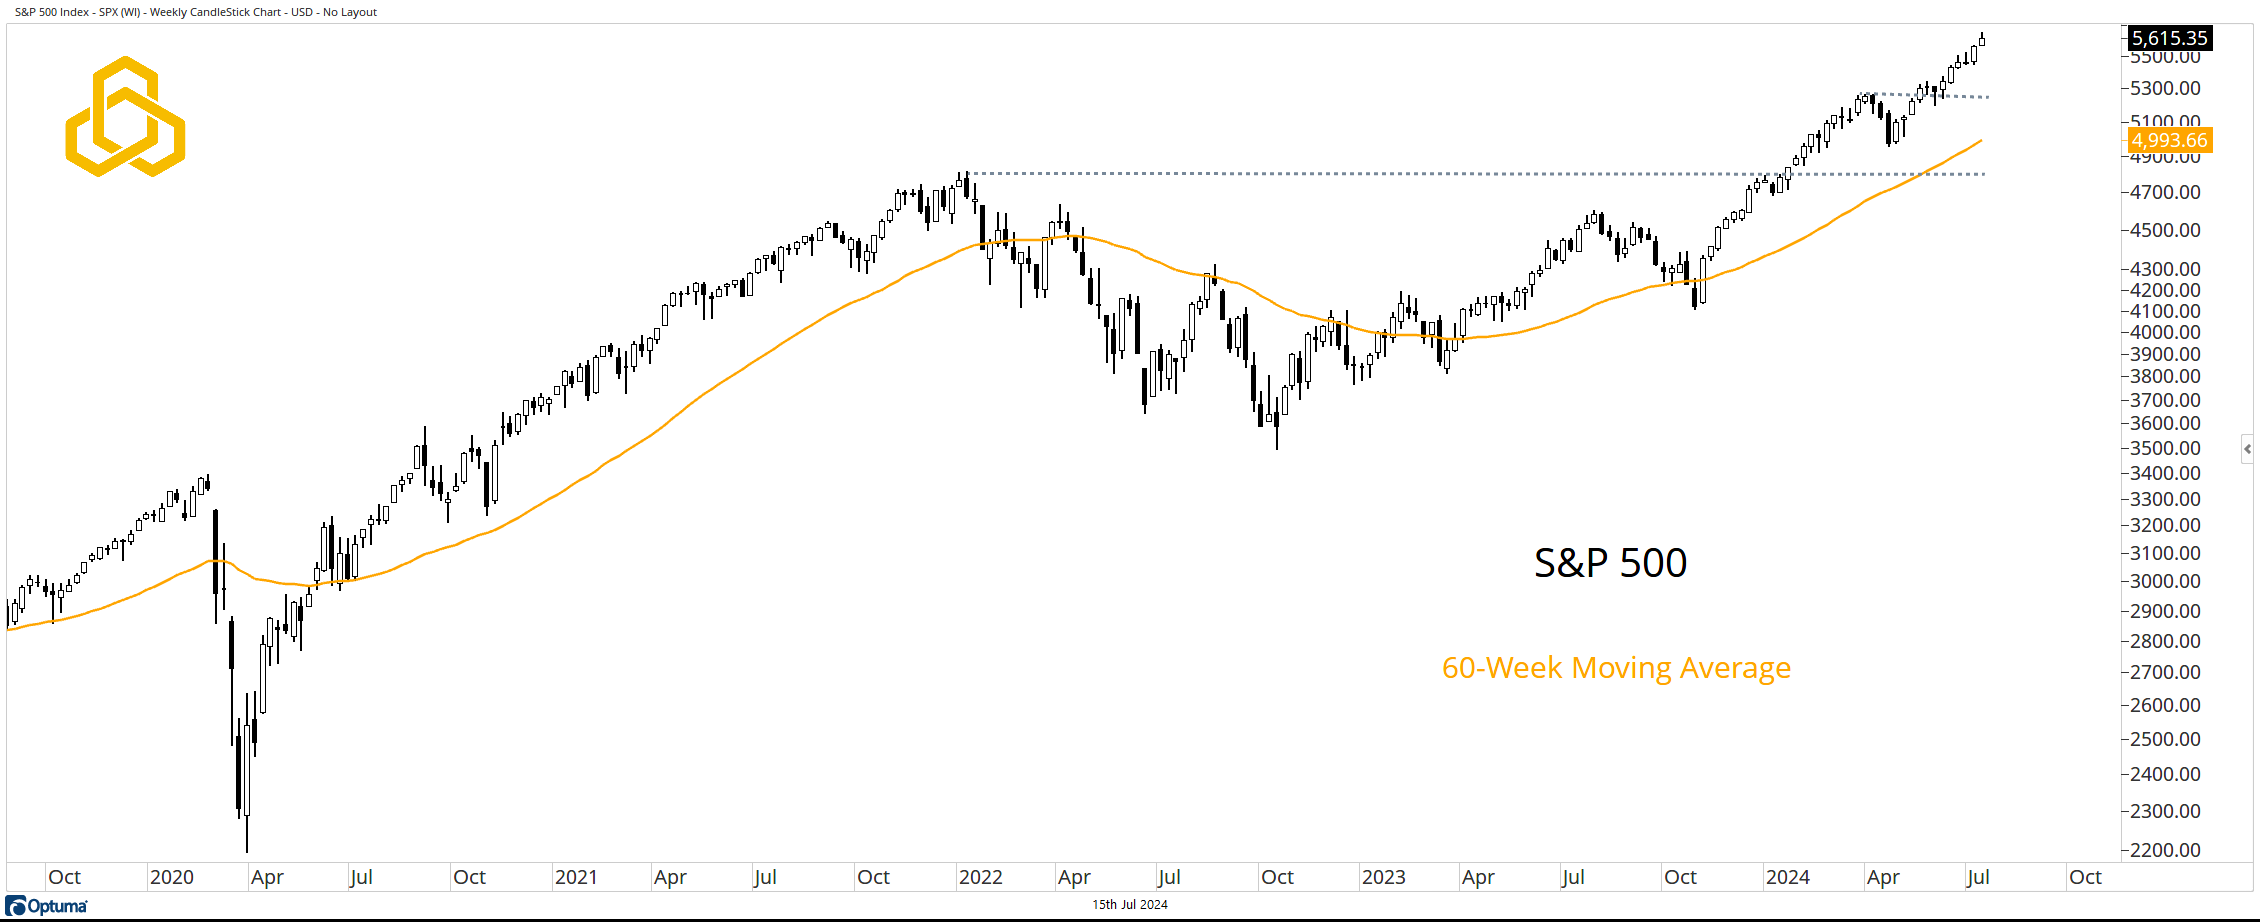
S&P 500
The main index in the U.S. registered another weekly closing highs last week and remains comfortably above the rising 60-week moving average. If I wanted to pitch a bear case, I would argue that the index is extended above the moving average, but I am not going to do that because I know that being extended to the upside is usually a poor “sell” signal.
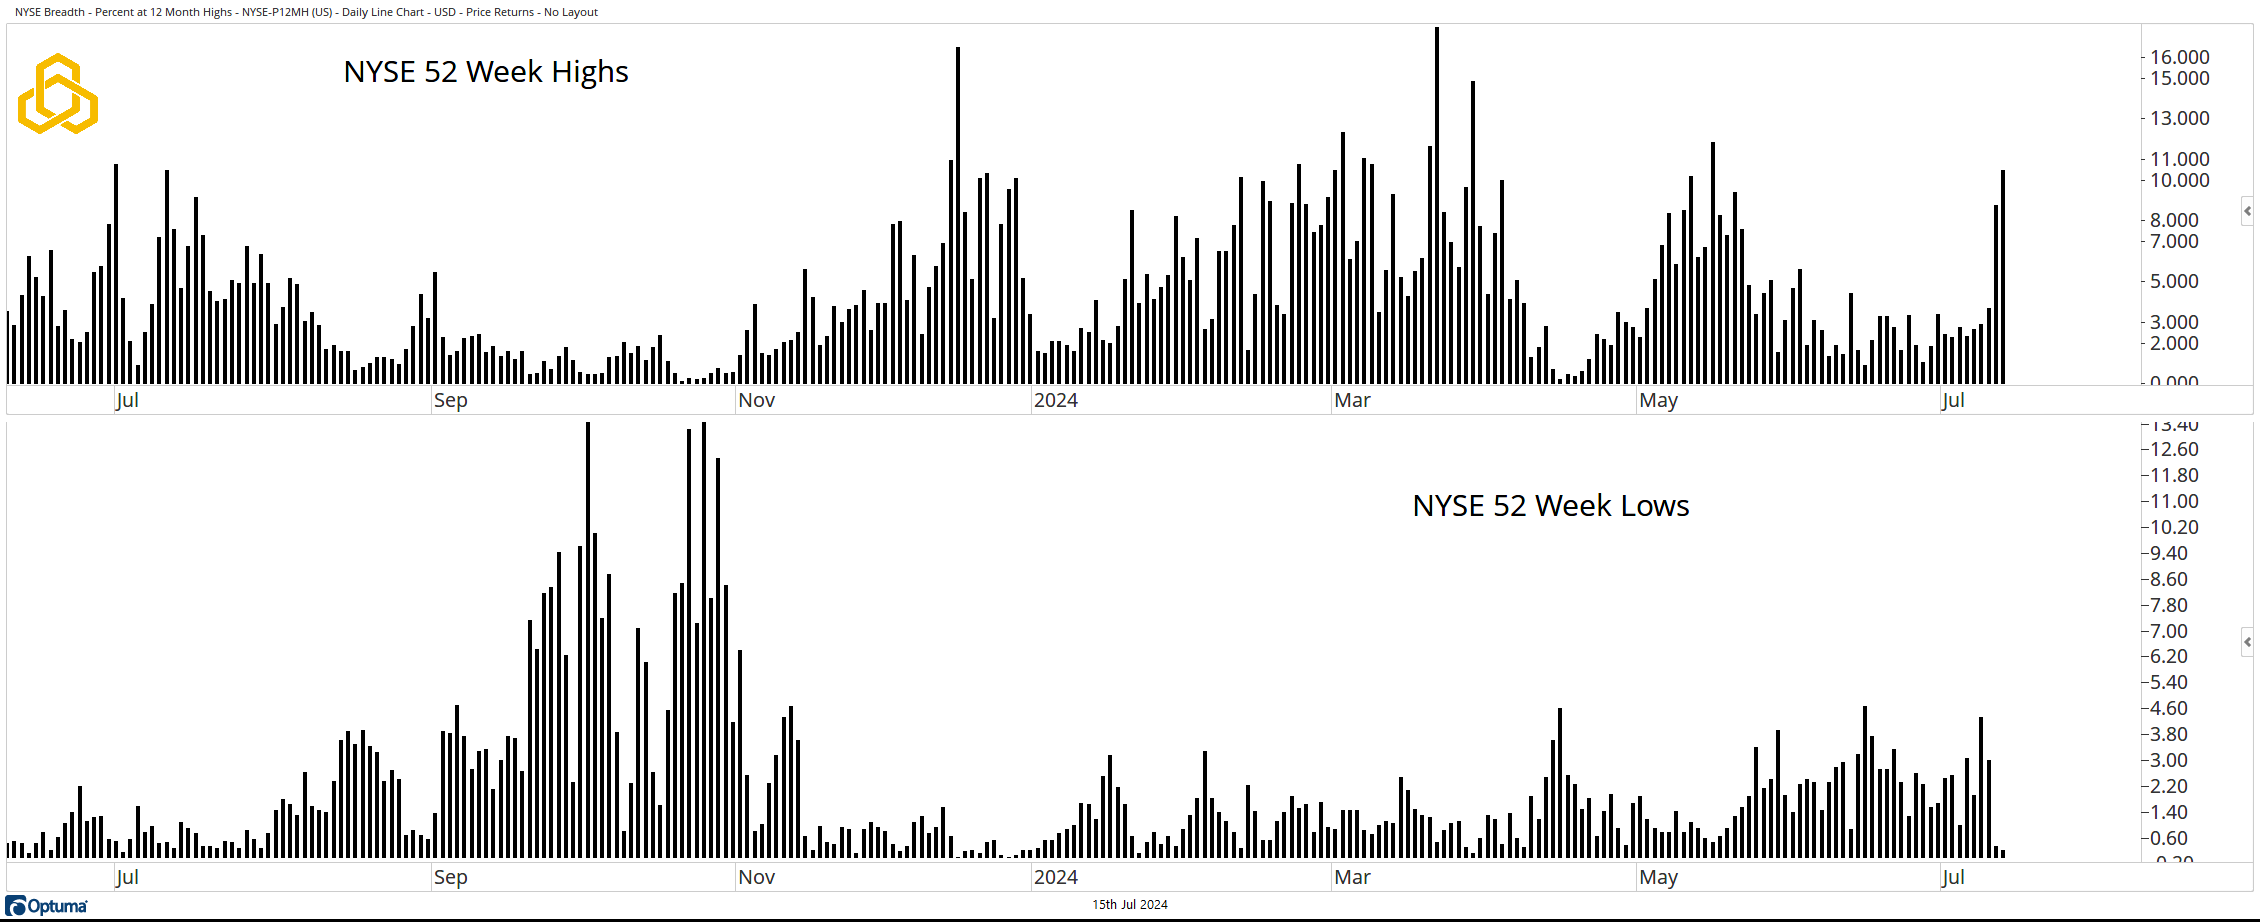
NYSE New Highs & New Lows
Last week saw a strong expansion in the percentage of stocks on the NYSE making new highs. At the same time, the percentage of stocks making new lows has fallen to less than 1%. In fact, there has not been a meaningful increase in new lows since 3Q2023.
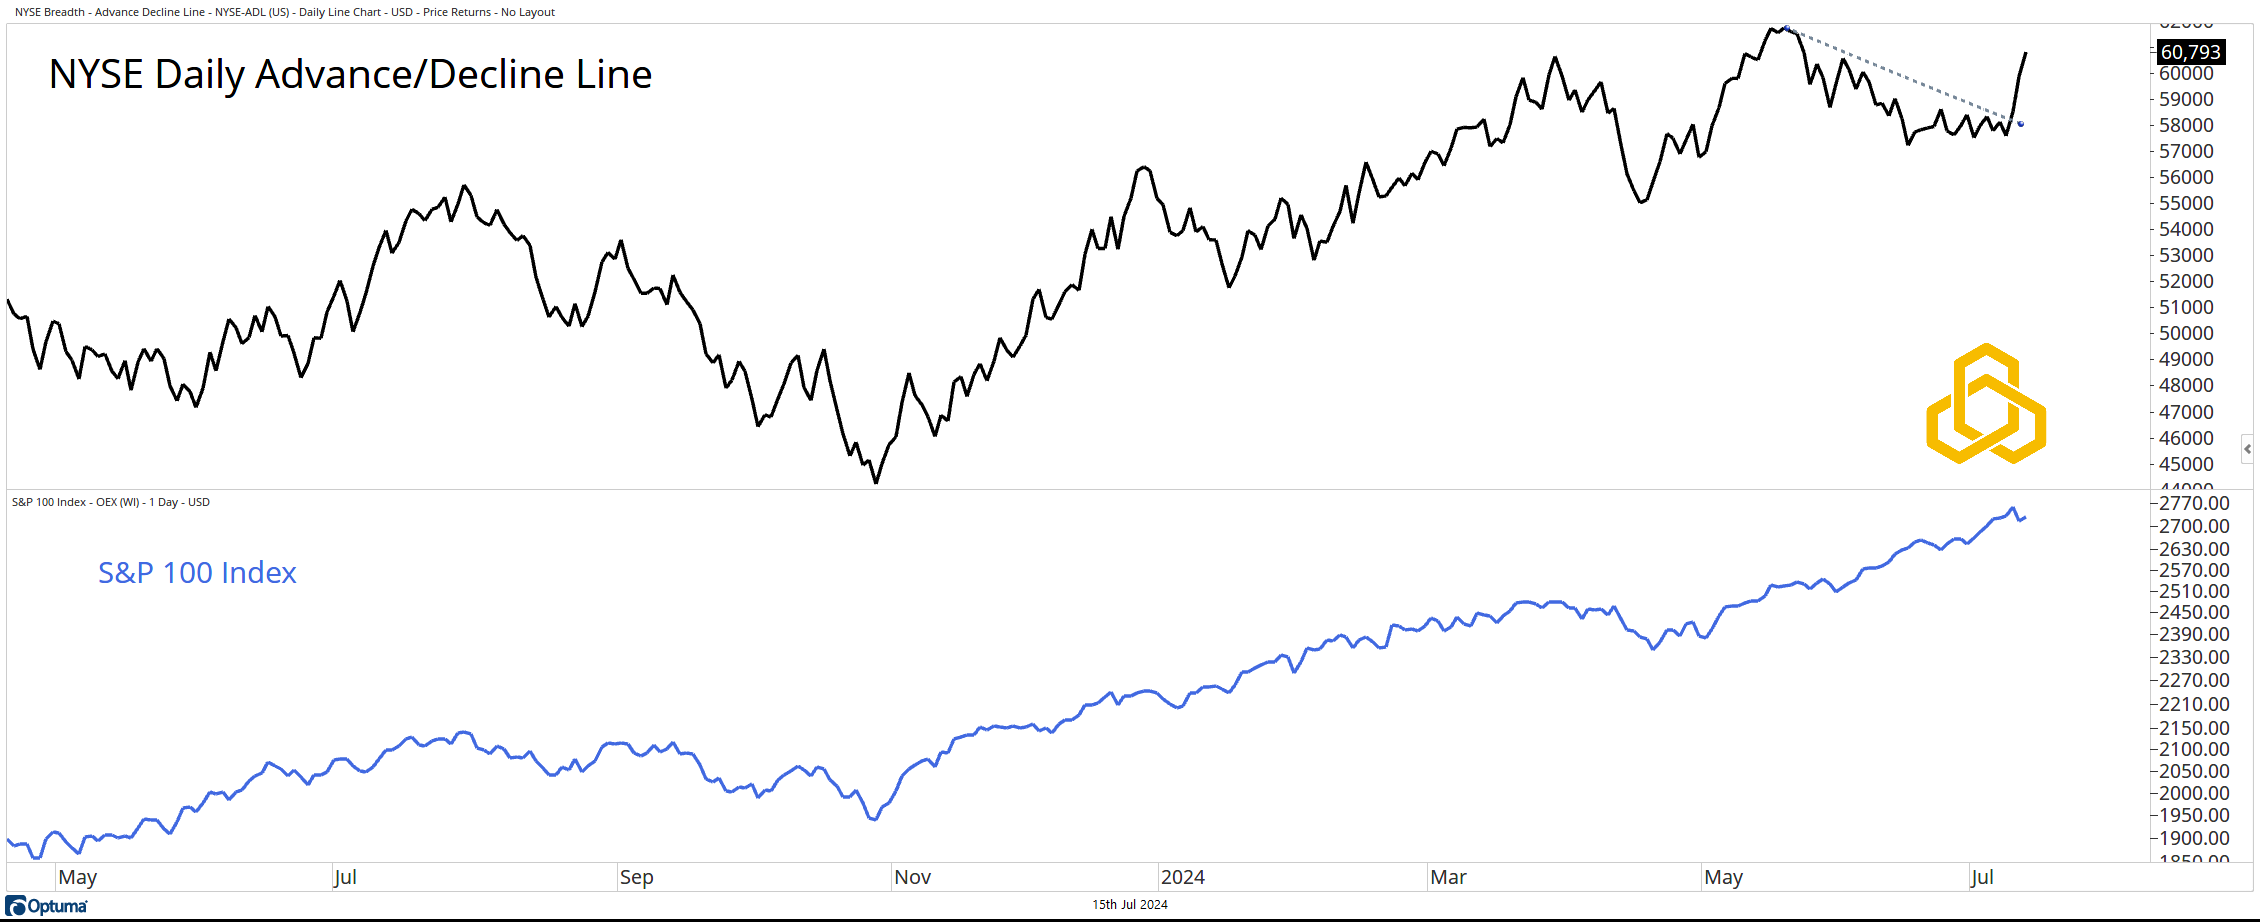
NYSE Advance/Decline Line
Not only was there an expansion in new highs, but there was also a strong move higher for the NYSE Advance/Decline Line (note that this is a stocks-only version of the A/D Line, the “all issues” version has actually made a new high).
The move higher in the A/D Line plays out against the backdrop of a ‘blue chip” index, the S&P 100, trading near record levels.
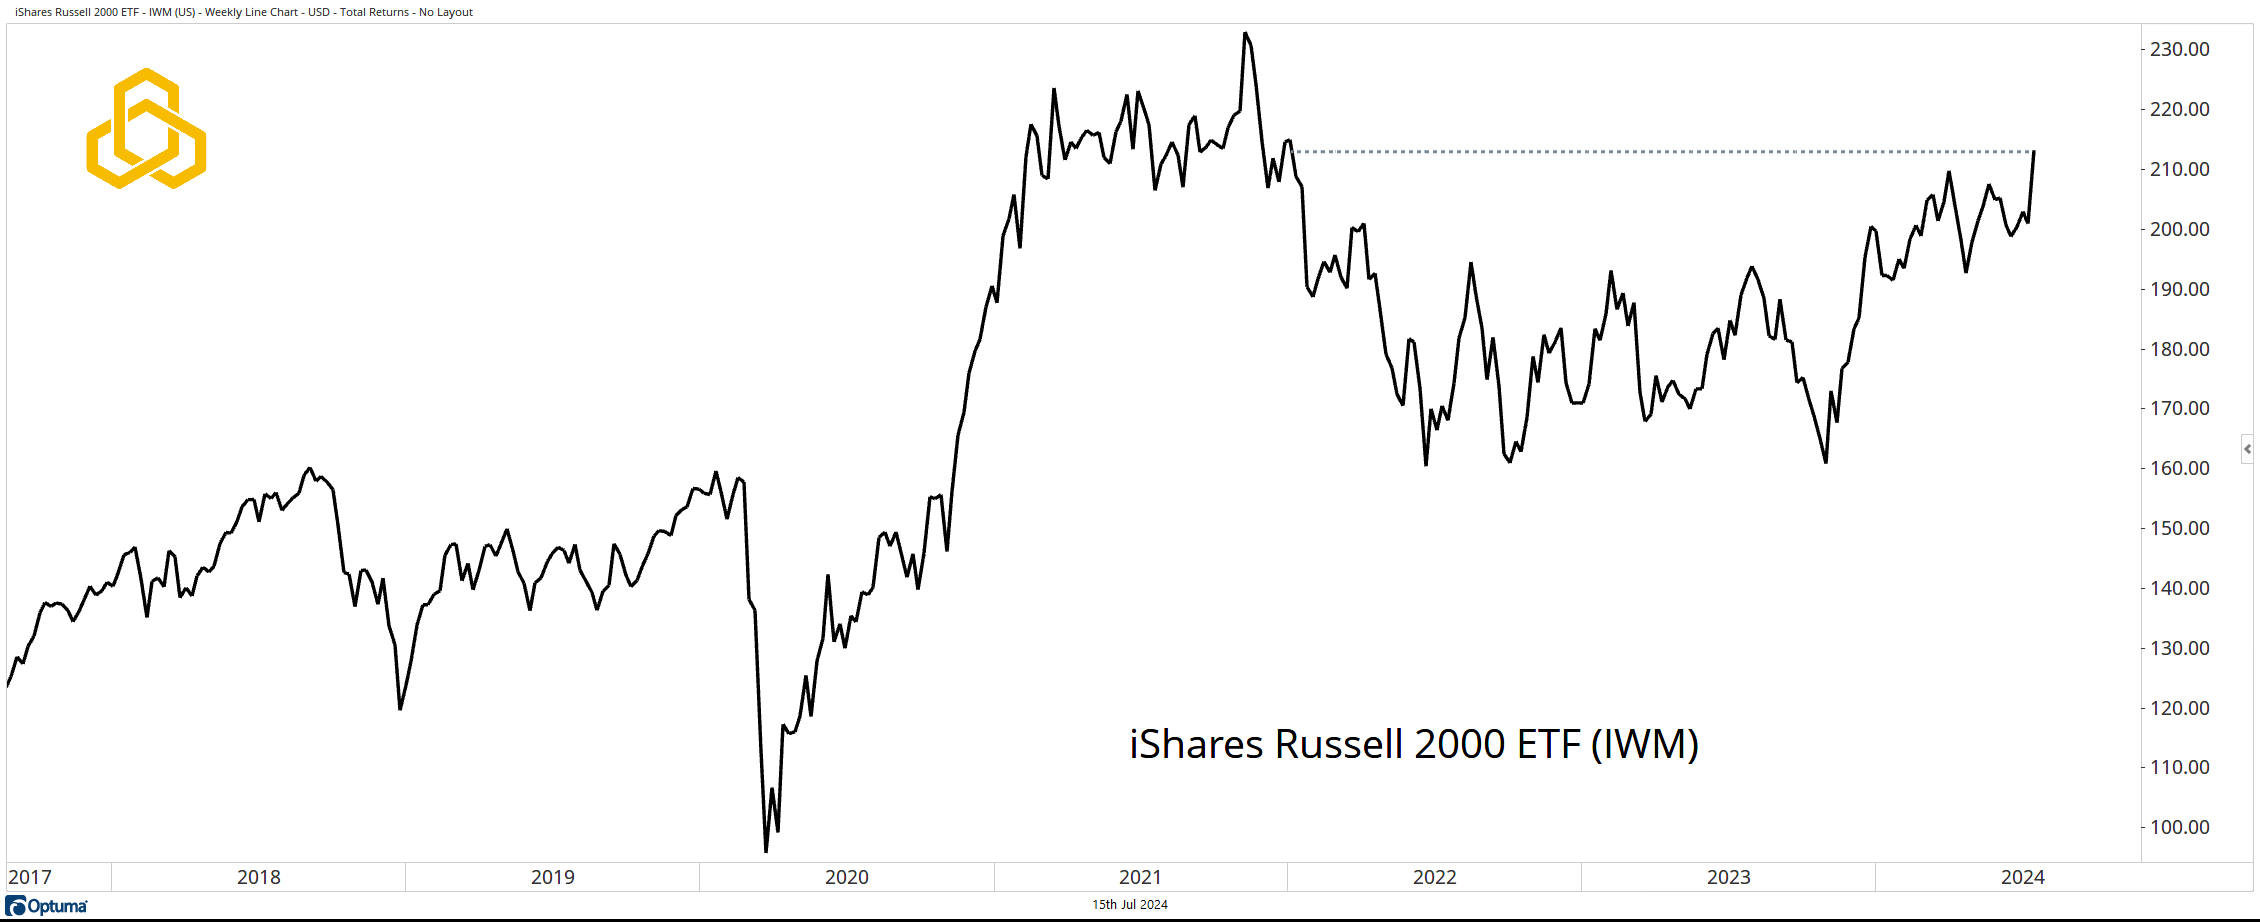
Small Cap Stocks
Many bears have argued that the fact that Small Cap stocks were not participating in the rally meant that the market was vulnerable. The iShares Russell 2000 closed the week at a new 52-week high, trading at a level not seen since January 2022.
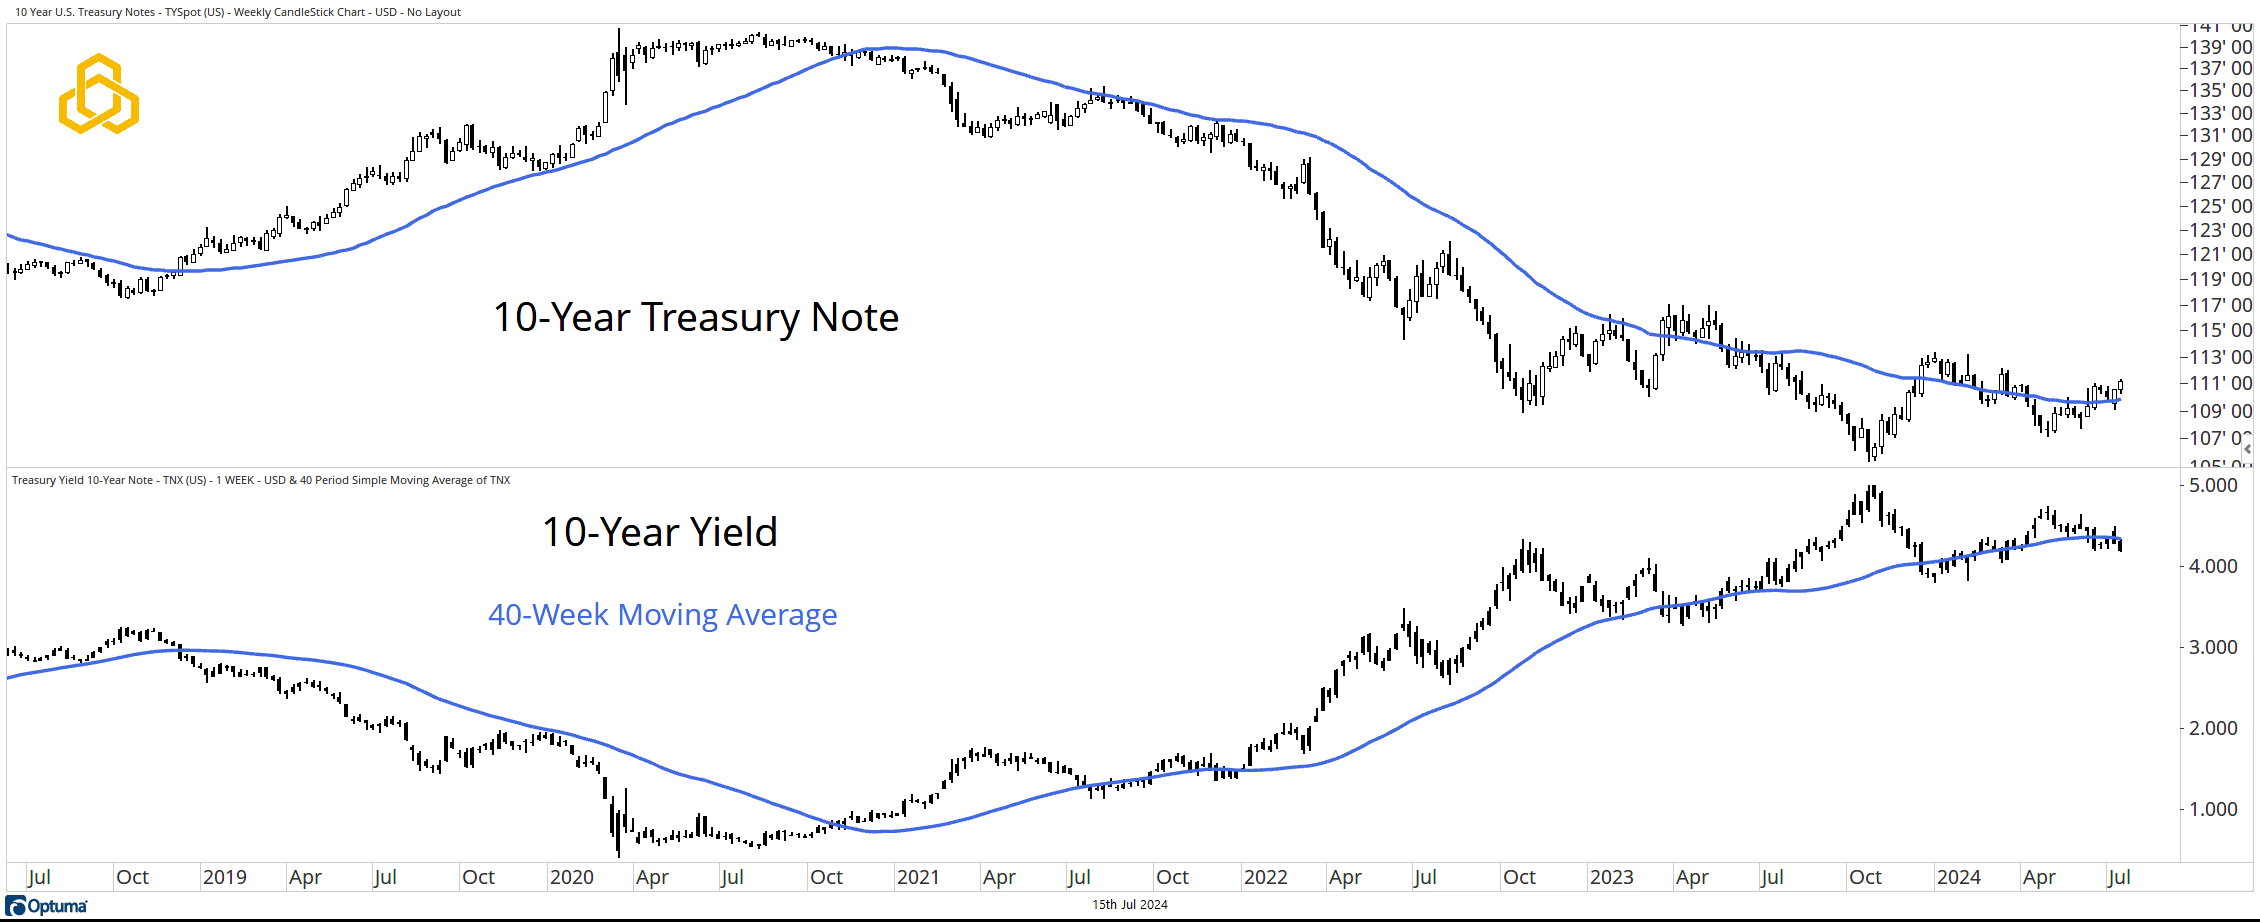
Ten-Year Treasury Note
The 10-Year Note, which we know has become positively correlated with the S&P 500 had a strong week, its fifth in a row above the now rising 40-week moving average.
The yield exhibits the opposite dynamics, moving inversely to price.
*All charts from Optuma as of the close of trading on July 12, 2024. Past performance does not guarantee future results.
Disclosure: This information is prepared for general information only and should not be considered as individual investment advice nor as a solicitation to buy or offer to sell any securities. This material does not constitute any representation as to the suitability or appropriateness of any investment advisory program or security. Please visit our FULL DISCLOSURE page.
PFM-343-20240715